SEO Competitive Analysis Tool: How to Choose and Use One
Compare rivals on keywords, SERP overlap, backlinks and AI mentions, then pick an SEO competitive analysis tool that fits your SaaS product.
You've pulled up a competitor's page in a search result. It's not the homepage. It's a comparison page you don't have, ranking for a query you'd never thought to write about, and it's been sitting there for eleven months collecting the buyers your product page should be winning. You check your own ranking for that term. Nothing. You check a related term. Also nothing. You close the tab and make a mental note to look at this again whenever things slow down.
That mental note is the problem. A single check tells you where everyone stands today. It doesn't tell you whether the rival climbed last month or on the day you looked, whether it's winning one query or forty, whether its page earns links you can't reach, or whether an AI assistant is now describing that competitor as the obvious choice in your category. You need the film, not the snapshot.
An SEO competitive analysis tool places your product beside named rivals on keyword rankings, SERP overlap, backlinks, share of voice and, increasingly, AI-assistant mentions, all in one dated view you can compare month over month. It doesn't find a competitor for you. It makes the comparison repeatable.
Table of Contents
- What an SEO Competitive Analysis Tool Actually Measures
- Core Features and the Question Each One Answers
- Reading Keyword Gaps and SERP Overlap Over Time
- Backlink and Technical Gaps Worth Acting On
- Tracking AI Mentions Beside Organic Rankings
- Evaluation Criteria for SaaS and Digital Product Teams
- Plan Tiers and What Each Costs
- Run Your First Competitor Review as a Shared Workflow
What an SEO Competitive Analysis Tool Actually Measures
Picture a scouting report. A coach watches one game and writes down the score. That's a rank check. Useful for an afternoon, meaningless by the next fixture. A thorough scouting report has weeks of footage: which plays the rival runs, who they run them against, what changed after their new signing, and where they're still weak. An SEO competitive analysis tool builds the footage.
Most tools combine three data layers. Search-result data covers keywords and the pages ranking for them. Crawled link data covers which domains link to which pages. Sampled answer data covers what AI assistants say when someone asks a buyer-intent question, collected by running prompts against provider APIs rather than by watching every consumer app.
The single most common way these numbers mislead is a metric with no definition. A tool that ranks share of search without saying whether it counts queries, users or referral traffic can put a different brand on top of the same market without changing a single fact.
The historical record shows how wide that gap gets. In December 2013, comScore measured Google at 67.3%, Microsoft at 18.2% and Yahoo at 10.8% of U.S. searches, while StatCounter's referral-based measure, taken over the same period, recorded Google at 80.23%, Bing at 9.62% and Yahoo at 8.41%, according to a history of search engine market share. Same market, same month, numbers nearly thirteen points apart on the leader.
That's why concentration matters to your workflow: Google's share of U.S. general-search queries reached 89.2% in 2020, per a measure cited in the United States v. Google court record, up from 80% in 2009. A small movement on the dominant engine touches a large share of your potential demand. Regional engines still carry weight in parts of China, Russia, South Korea and Japan, so check what a tool covers before you trust its gaps.
The rule that prevents most bad comparisons: state the metric and the time window before you put two brands on the same line. "Share of voice, tracked queries, monthly, Jan to Mar" is a benchmark. "We're behind on visibility" is a feeling.
Say you run a project-management SaaS and a rival ranks first for six of your ten core comparison queries. On a snapshot, you're six losses down. With a dated sheet behind that snapshot, you can see whether those rankings appeared after their integrations directory launched, whether they held through a Google update, and whether your absence is a content problem or an indexing one. The conclusion changes; the six losses don't.
The end state of the setup is modest and specific: one shared benchmark sheet with your rivals side by side, a gap list sorted by what's worth doing first, and a baseline you can judge every future change against. Everything else in this article either builds that sheet or explains how to read it without fooling yourself.
Core Features and the Question Each One Answers
Five capabilities separate a serious tool from a rank tracker with a competitor dropdown. Each answers a different question, and each has a predictable way of going wrong. Read them as a hierarchy: the first two establish where demand exists, and the last three explain why a rival is holding it.
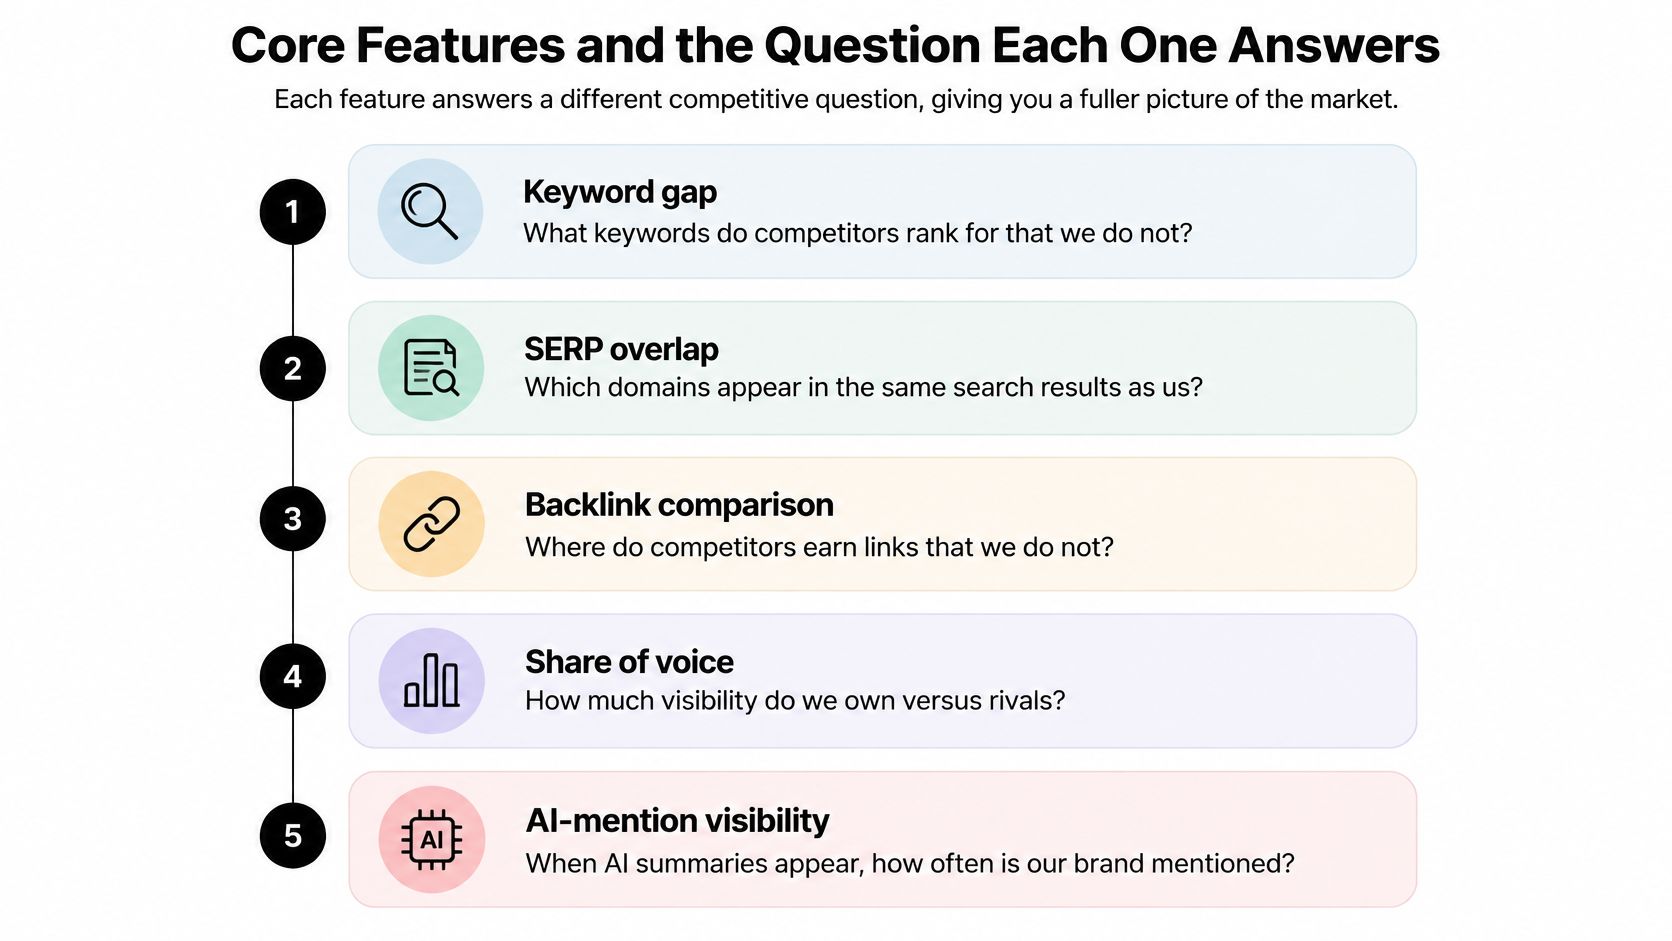
Keyword gap answers which valuable queries a rival ranks for and you don't. It's the feature buyers often choose first, and its number is the least portable: volume estimates differ between vendors, so a gap you measure in one tool should never be sized against a figure from another. Compare inside one data source and the ranking order stays honest.
SERP overlap answers which rivals share your results pages. If four of your five tracked competitors appear in the top ten for your priority keyword, you're in a crowded auction; if two of the four sit at positions 8 to 10, that's a fight you might choose, or deliberately skip while you build depth elsewhere. High overlap combined with weak positions on your side is a warning, not an invitation.
Backlink comparison answers where rivals earn links you don't have. The unit is referring domains, not links, and the useful output is a short list of reachable sites rather than a long one of authoritative ones.
Share of voice turns your tracked results into one percentage: how much of the visibility in your keyword set each brand captures. It's the number executives find easiest to grasp and the easiest to rig, because the set you track determines the answer. Track your ten brand-adjacent, easy-win terms and your share of voice looks excellent.
AI-mention visibility answers how assistants describe and recommend brands in your category. It's the newest layer and the one most often read carelessly. A visibility score covers the prompts, providers and dates you chose, not every AI answer in the world, and the sampled checks don't reproduce every consumer app experience or reach Google's AI Overviews.
The table below is the reference point for the rest of this article.
| Feature | Question It Answers | Primary Metric | Common Trap |
|---|---|---|---|
| Keyword gap | Which valuable queries do rivals rank for that I don't? | Shared and missing keywords by volume and difficulty | Volume estimates differ between tools, so compare inside one source |
| SERP overlap | Which rivals compete for the same results page? | Share of your keywords where each rival ranks in the top 10 | High overlap with weak positions signals a fight to pick carefully |
| Backlink comparison | Which domains link to rivals but not to me? | Referring domains, link growth and page authority | Raw link totals hide low-quality volume |
| Share of voice | What share of tracked demand does each brand capture? | Percentage of tracked results that show each brand | A biased keyword set produces a biased percentage |
| AI-mention visibility | Which brands do assistants recommend and how do they describe them? | Visibility, average position, sentiment and cited sources | Answers come from sampled provider checks, not every consumer app |
A useful order of work: keyword gap and SERP overlap first, because they tell you where demand is. Links and AI visibility second, because they explain why someone else is holding it.
Reading Keyword Gaps and SERP Overlap Over Time
One ranking check tells you almost nothing about cause. Search is a moving system, and a result you record on a Tuesday can shift by Thursday because Google changed something nobody announced. A dated series is what separates "our competitor is beating us" from "the whole category moved."
The scale of that movement is worth internalizing. Search Engine Land reports that Google made 4,725 changes to Search in 2022, changes to ranking systems, interfaces and other features, an average of roughly 13 per day, as tracked in its library of Google algorithm updates. Against that volume, a team reacting to a single day's dip is guessing.
Build the analysis in six moves.
- Define the rival set. Three to five direct competitors plus one aspirational leader. Anything above five and the sheet stops producing decisions. Leave out Wikipedia and Reddit; note where they appear, don't benchmark against them.
- Pull ranking keywords for each domain. Then strip branded terms, because a rival ranking for its own name tells you about its brand, not its content.
- Mark gaps. Keywords where a rival ranks in the top 10 and you don't, then sorted by commercial relevance rather than volume. A tool's biggest-volume gap is often a glossary term nobody buys from.
- Measure overlap. For each target keyword, note which rivals share the page with you. Track this as a share of your keyword set so it's comparable month to month.
- Date everything. Log the result, the date, and any known event on your side or theirs. The rival's three-position climb becomes meaningful when it lands eight days after their pricing page rewrite.
- Compare, then decide. Two consecutive reviews showing a widening gap is a trend. One review showing movement is weather.
A practical rule for dips: before you rewrite anything, check whether the whole keyword cluster moved or only your page. Cluster-wide movement points at the search engine; single-page movement points at you.
The update history is the reason this matters. Panda in 2011 went after low-quality and thin content, Penguin in 2012 addressed link spam and unnatural anchor text, Hummingbird in 2013 improved semantic interpretation of query intent, and the 2022 Helpful Content Update targeted pages built mainly to manipulate rankings. Each one moved whole categories of pages at once. A team with no stored history reads a market-wide reset as a competitor's sudden brilliance and rebuilds a page that was never the problem.
If you want the fuller method for setting rival benchmarks and keeping them comparable quarter to quarter, our guide to competitor benchmarking walks through the setup.
The most common reading error is treating a gap as an opportunity without checking intent. A rival ranks for "best project management software for agencies" because its page is a comparative breakdown with pricing, limitations and a clear recommendation. If your page is a features list, closing the keyword gap means writing a different page, not adding the phrase to your existing one. A gap is only an opportunity when you can build the thing the ranking page is.
Backlink and Technical Gaps Worth Acting On
A rival's backlink count means little if its ranking page serves a different intent or your equivalent page cannot be crawled. Check the technical basics first, then compare links between pages that target the same kind of search.
Inspect whether each rival page is indexed, how many clicks deep it sits in the site's internal links, whether it appears in the sitemap, whether its canonical points to itself, and whether its structured data is valid. Google's Search fundamentals documentation explains how sitemaps, crawlable links, and structured data support discovery and search appearance. Run the same checks on your equivalent page.
Fix access problems before adding keywords. A page that search engines cannot reach has little chance to compete, regardless of how closely its copy matches a query. Rank issues by severity, not just by the number of keywords involved.
Apply the same discipline to AI visibility, but keep the measures separate. Search accessibility can help a page qualify to appear in search results; it does not prove that an AI assistant will retrieve or cite it. Treat technical checks as diagnostic signals, not guarantees.
Then compare links using a consistent metric and time window. The table's reference points are typical comparison methods, not universal thresholds.
| Metric | What It Reveals | Reference Point | Common Pitfall |
|---|---|---|---|
| Referring domains | Breadth of unique sites linking to a page or topic | Median of the ranking competitors for each target query | Counting total links treats ten links from one site as equal to ten from ten different sites |
| Monthly followed-domain gain | Acquisition pace for a competing page | Compare the top-three pages over the same period | One month can be noisy, so judge the trend over a quarter |
| URL Rating | Page-level link authority | Compare the linking pages with one another | Domain-level scores can mask weak linking pages |
| Shared linking domains | Sites that link to rivals but not to you | Prospects ranked by relevance and authority | A large list of unreachable sites is not a plan |
Build a working list for each priority topic: record the median referring-domain count among ranking pages, track changes in followed referring domains for the top three over a quarter, and identify sites linking to rivals but not to you. Filter that overlap by page-level authority and topical fit. A site that links to software reviews may be a better prospect for a product comparison page than for a pricing page.
Prioritize prospects you can reach through original research, integrations, partner content, documentation, or expert commentary. For each link, record the target URL, anchor context, follow status, and topical fit. For guidance on the content and technical work behind improving Google search visibility, see the related guide.
Tracking AI Mentions Beside Organic Rankings
A product can rank first in organic results yet remain absent from the answer an assistant gives to a buyer. Rankings and estimated traffic describe one part of the competitive picture; AI-generated answers create another, especially when a summary satisfies a search without a click.
Independent reporting citing Pew research found that users clicked traditional website links in only 8% of Google searches containing an AI summary, compared with 15% when no summary appeared, and that 1% clicked source links inside the AI Overview, as covered in reporting on AI Overviews click behaviour.
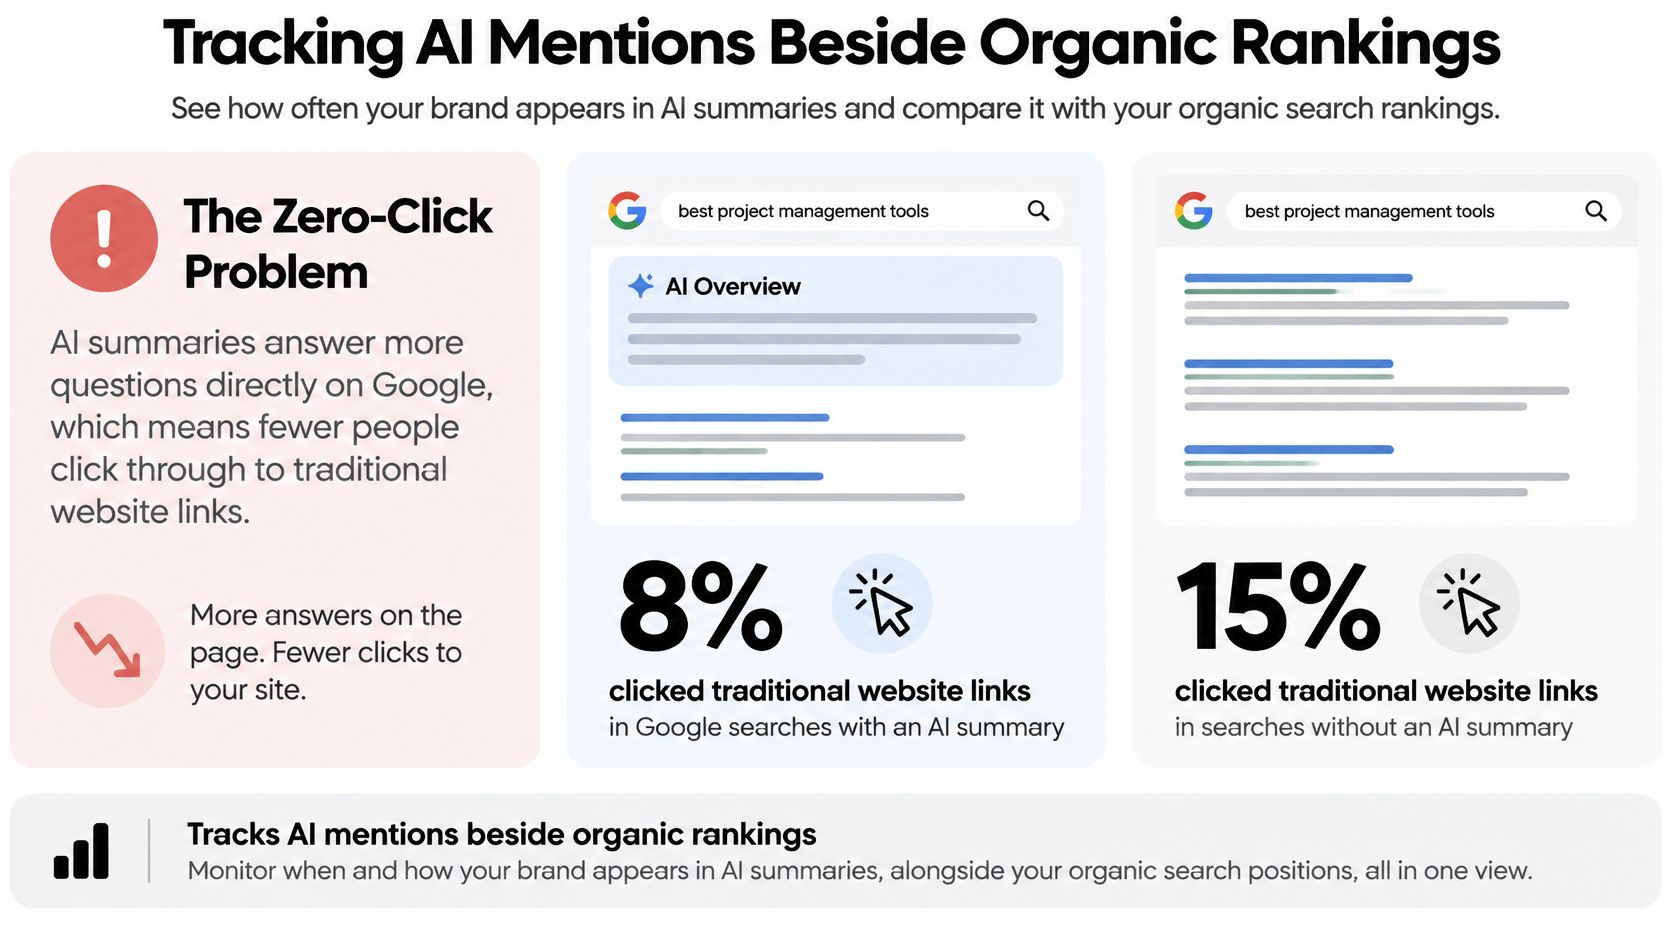
That changes what a competitive report needs to compare. Alongside rankings, track whether each brand appears in AI answers, how it is described, its sentiment and position when recommended, and which URLs are cited. Define the metric and time window before comparing rivals: visibility is the share of tracked answers where your brand appears, for the prompts, providers and reporting period selected. It does not represent every AI search.
The sample has boundaries. Provider checks use APIs; they do not reproduce every consumer app experience or track Google AI Overviews, Google AI Mode or Microsoft Copilot. For a closer look at the measurement and comparison process, see this guide to LLM visibility tracking.
Keep three signals separate:
- Visibility is how often a brand appears in the tracked answers during the selected period. It is a sample-based comparison, not market share.
- An AI traffic visit is a website session classified from a detectable AI source. It is separate from a mention, signup or purchase.
- A conversion is recorded in your analytics or billing system. A referral alone does not prove that a visitor bought.
MyMentions brings AI mentions, position, sentiment, competitors, citations and AI-driven traffic into one workspace, so teams can compare assistant answers with visits to their site. Its tracking script records visits classified from detectable AI sources, along with landing pages and engagement. Missing referrers, blocked scripts and source classification can affect coverage. Measure completed conversions in your own analytics or billing system.
Traffic volume needs context too. An Ahrefs analysis of 81,947 websites found AI traffic grew roughly tenfold over the prior year, yet represented only 0.25% of total site traffic on average, while average search traffic declined about 21%, according to Ahrefs' study of AI traffic. Growth rate and traffic share answer different questions: one shows how quickly a source is changing, the other how much traffic it currently contributes.
Client studies also suggest AI referrals convert differently by provider, which is why assistants should be compared separately rather than averaged into one AI traffic figure. A referral count by itself cannot show which competitor is winning qualified AI-assisted demand, on which provider, or which page is doing the work.
Classify cited URLs by type: pricing page, documentation, review, integration page or editorial content. The source an assistant uses can show which pages support its answer and where your own content may leave a gap. Separate informational mentions from product recommendations as well. An accurate description in an explainer and a recommendation to choose a product are different outcomes.
Keep two scoreboards: organic rankings and answer-engine visibility. For each, state the metric definition and time window, then report citations, traffic and conversions separately. That way, a change in one measure does not get mistaken for a change in another.
Evaluation Criteria for SaaS and Digital Product Teams
Choose by stage and by question, not by feature list length. A pre-launch product needs to know which category terms it can realistically enter. A growth-stage team needs to know why a named rival keeps beating it on comparison queries. An established product needs to defend share of voice and measure assisted conversions. Those are three different tool requirements.
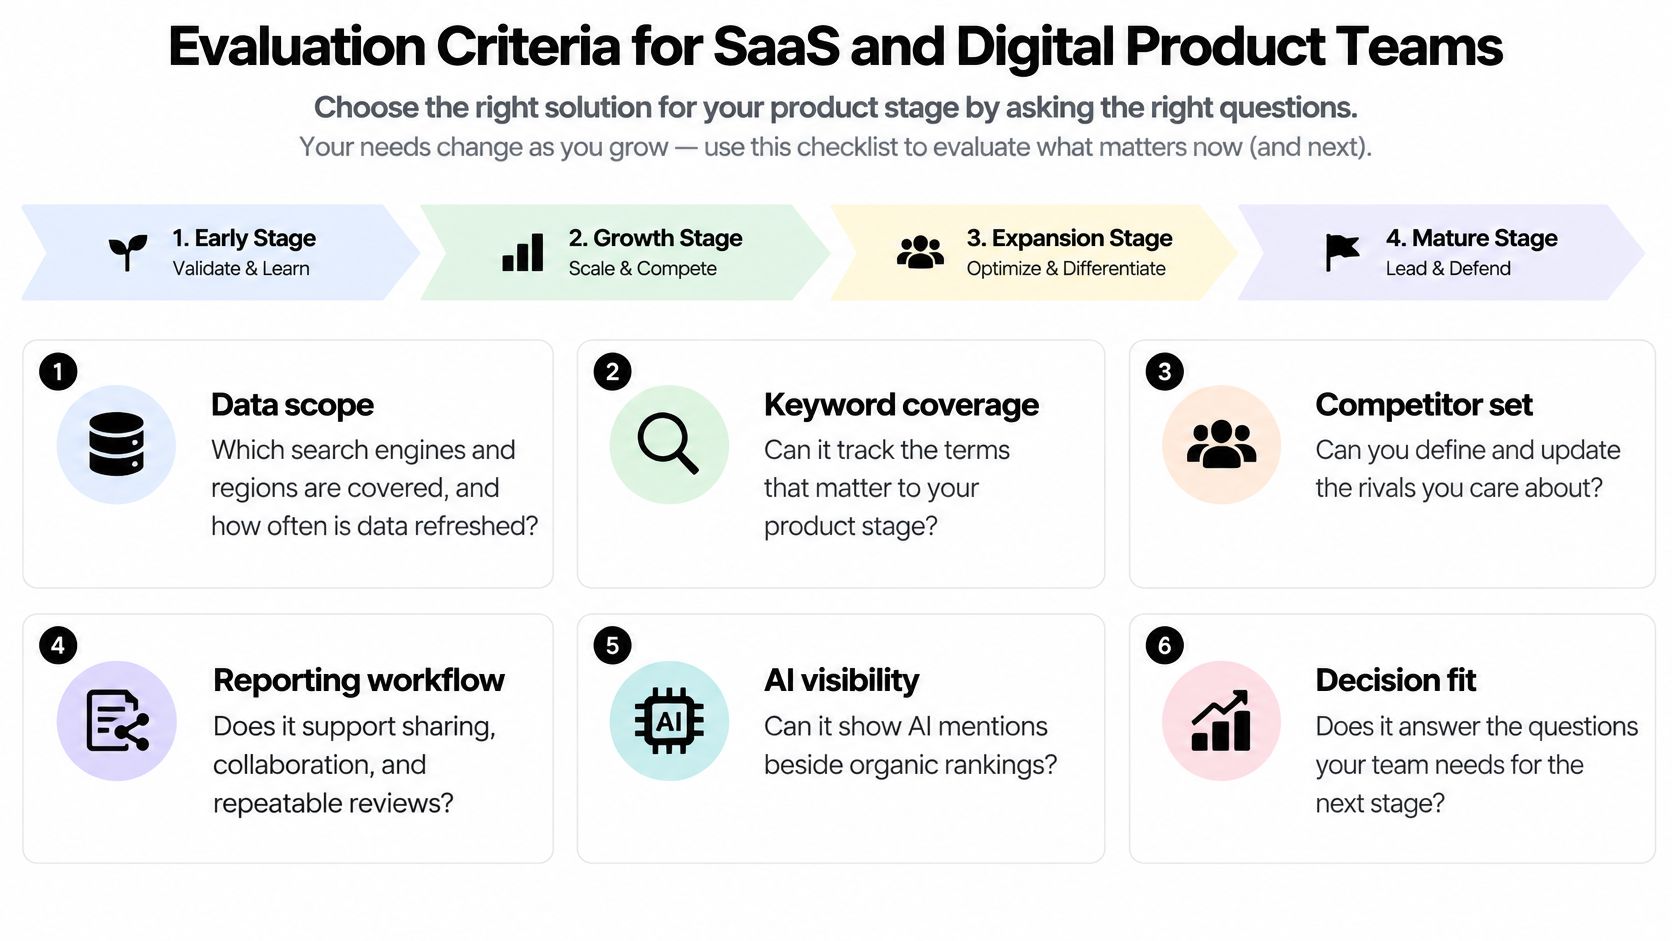
Put these six questions to any vendor, in this order.
| Criterion | Question to Ask | Red Flag |
|---|---|---|
| Data scope | Which search engines and regions are covered, and is the metric definition stated? | Share figures with no stated metric |
| Refresh frequency | Is data daily or weekly, and is history kept so trends can be dated? | No stored history |
| Competitor set | Can I add named rivals and benchmark share of voice and sentiment against them? | Fixed competitor list with no benchmarking |
| AI coverage | Which assistant providers are checked, how many prompts per day are allowed, and is it stated that provider checks do not reproduce every consumer app or track Google AI Overviews, AI Mode or Copilot? | Visibility figures with no sample size or coverage limits |
| Traffic attribution | Can AI visits be tracked, and what reduces coverage such as missing referrers, blocked scripts or weak source classification? | AI visits presented as conversions |
| Outputs and workflow | Are alerts, exports, recommendations and team seats included? | Scores presented as ranking factors or guaranteed mention growth |
Two of those deserve expansion. On data scope, ask explicitly whether the tool keeps history. A daily refresh with no archive gives you a better snapshot, not a better trend, and trends are what you're buying. On traffic attribution, ask what degrades the measurement. Missing referrers, blocked scripts and source classification all affect AI traffic tracking coverage, so any vendor claiming complete attribution is either guessing or not measuring precisely.
Test before you commit: run your shortlist on the same five rivals and one fixed prompt list. Two tools will produce different absolute numbers. What you're checking is whether they agree on the direction and rough size of the gap.
Keep red flags separate from preferences, because they're disqualifying rather than annoying. A score presented as a ranking factor, a promise of guaranteed mention growth, and a visibility percentage with no sample size behind it are all reasons to close the tab. A tool describing a visibility score will tell you it covers the responses collected for the selected prompts, providers and reporting period, and nothing wider.
If you're comparing this against broader platform choices for a product team, our breakdown of an SEO platform for digital teams covers how the pieces fit together.
Plan Tiers and What Each Costs
Suppose your team tracks ten buyer-intent prompts across eight providers. That requires 80 provider checks a day to cover every prompt with every provider. A prompt checked across eight providers uses eight checks; ten prompts across three providers use 30. Calculate prompts × providers × daily frequency, then compare the total with the plan limit.
| Plan | Monthly Price | Provider Checks per Day | Providers Tracked | Team Seats |
|---|---|---|---|---|
| Starter | $49 | 25 | 3 (OpenAI, Google Gemini, Perplexity) | 1 |
| Pro | $99 | 50 | 8 | 2 |
| Enterprise | $199 | 100 | 8 | 5 |
MyMentions offers three tiers. Starter costs $49 per month and includes 25 provider checks per day, daily data updates, AI traffic analytics, root cause analysis, and PDF reports. It tracks OpenAI, Google Gemini, and Perplexity, and is designed for an individual product starting AI search tracking.
Pro costs $99 per month and includes 50 checks per day, two team seats, and tracking across eight providers. It adds citation source analysis, daily alerts, and recommendations matched to your site. Enterprise costs $199 per month and includes 100 checks per day, five seats, scheduled reports, and competitor tracking. Both Pro and Enterprise include eight-provider tracking.
A team can start with Starter and upgrade when it needs more daily checks, eight-provider coverage, recommendations, integrations, or additional seats. Every paid plan starts with a 7-day free trial.
Check the daily total before choosing: If your prompt and provider count exceeds a plan's daily provider-check limit, that tier won't cover the full prompt list each day. For example, 34 checks a day calls for a tier with a limit that covers 34, such as Pro.
Run Your First Competitor Review as a Shared Workflow
A useful competitor review works like a scouting report: it records what each rival is doing, defines how the team will compare results, and gives every follow-up a clear owner. Set the scope before comparing numbers. For AI visibility, record the metric definition and reporting period so the benchmark has a consistent basis.
- Set a shared scope. Choose five rivals and a fixed list of buyer-intent prompts. Define share of voice and write down the time window. Marketing and product can then interpret “behind” using the same measures.
- Run the gap and overlap analysis. Record the results with the date, in the same place each month. Keeping the rival set consistent makes changes easier to compare.
- Assign content gaps to marketing. Check whether a rival page better answers the query, then write a specific brief. “Add the keyword” is too vague; “build a comparison page that covers pricing and limitations” gives the writer a task to investigate.
- Assign technical and product-page gaps to product. Review indexing, internal links, structured data, pricing pages, and documentation. These checks help distinguish a content gap from a site or product-page issue.
- Review backlink trends and route prospects. Send research and integration opportunities to partnerships, and documentation or expert commentary opportunities to the content team. A quarter-long view gives more context than a single month.
- Check AI visibility by provider and cited page. Compare the tracked answers provider by provider, then classify cited URLs as pricing pages, documentation, reviews, or editorial content. Citation patterns show which sources appear alongside brand mentions, not whether every assistant answer cites the same pages.
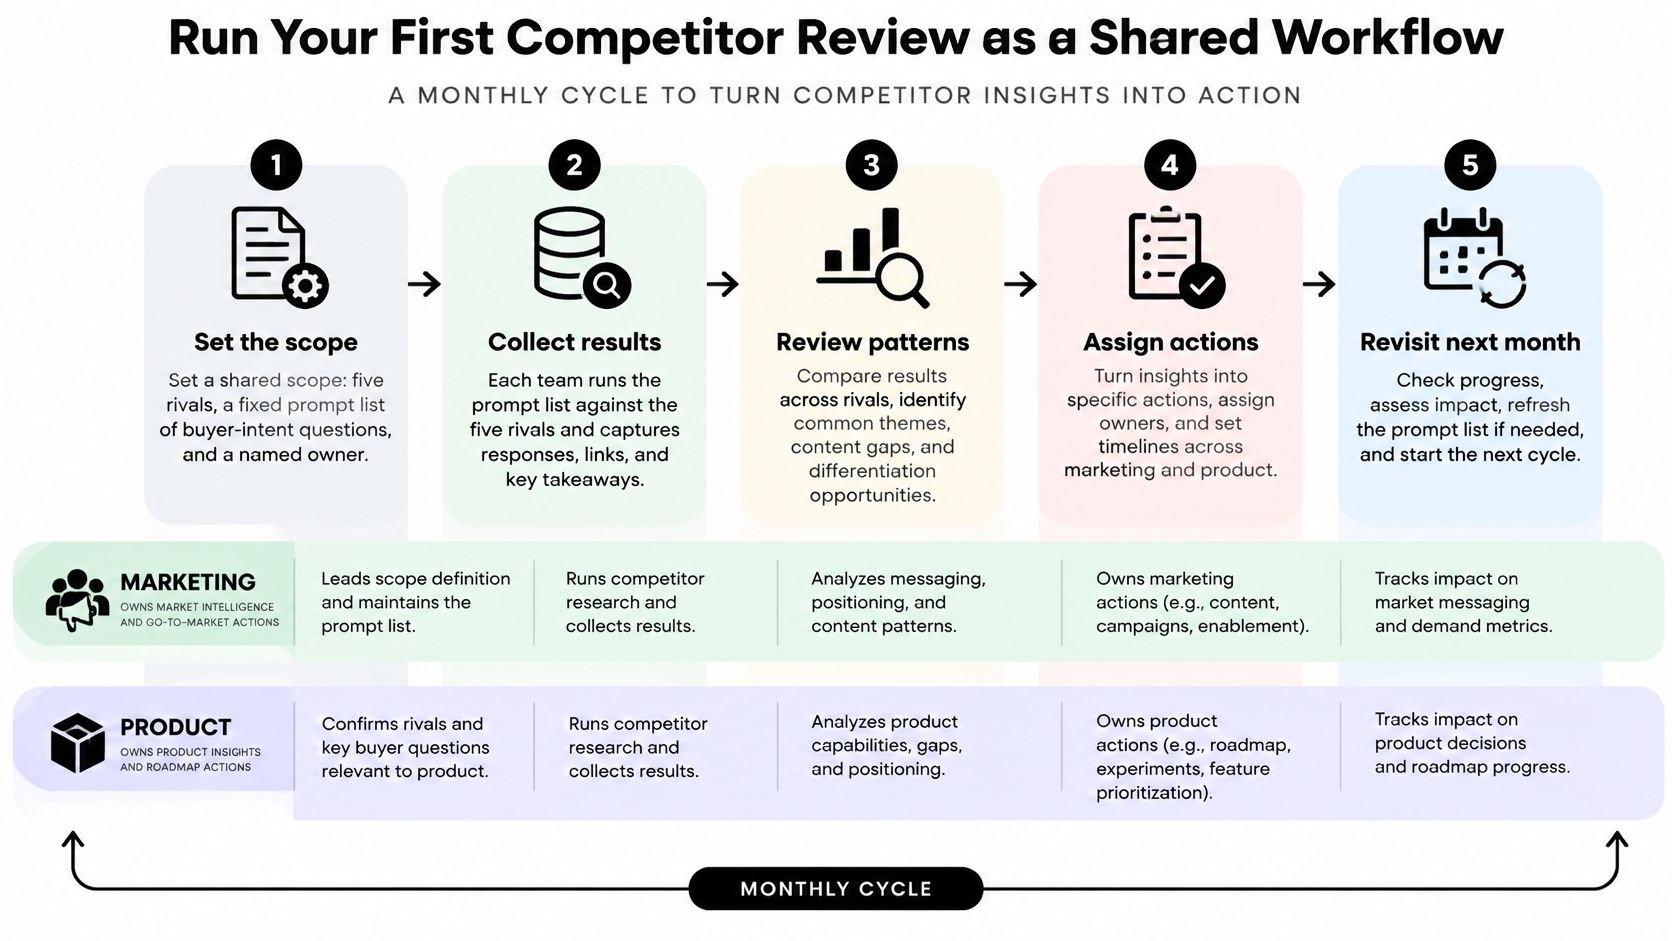
Ownership turns observations into assigned work. Marketing can revise a comparison page; product can investigate a canonical tag. Put each action with the team able to address it, then review progress alongside the next benchmark.
For help prioritizing fixes by cost and expected effect, see this guide to SEO recommendations.
Start with five rivals, ten prompts, and a page of clearly defined metrics. Keep the prompt set and reporting window consistent between reviews, so a change in results has context.
To begin in MyMentions, create a product and choose a plan. The workspace shows how AI assistants mention, rank, and describe the brand. Add competitor brands to compare share of voice and sentiment. Coverage depends on the plan: Starter tracks three providers, while Pro and Enterprise track eight. Set a date for the next review before closing the first one.
Organic rankings and links tell only part of the story. AI answers add a competitive layer, including zero-click mentions that may not send a visit to your site. MyMentions brings AI visibility, position, sentiment, citations, competitors, and AI-driven traffic into one workspace. For Pro and Enterprise, citation source analysis reviews source URLs returned with AI answers alongside brand mentions. Its position metric is the average rank when your brand is recommended, while visibility is the share of tracked answers where it appears. A visit attributed to an AI source is separate from a mention or a completed conversion. Visit MyMentions to start.