
A competitor can look weak in Google and still win the answer that a buyer receives from an AI assistant. That reversal is why traditional competitor benchmarking no longer gives digital teams a complete view of market position. Search rankings, backlinks, traffic estimates, pricing pages, reviews, and share of voice still matter, but they don't explain which brands AI systems discover, cite, recommend, or describe as credible.
Effective benchmarking is a repeatable decision system, not a spreadsheet of competitor observations. You need a comparable peer set, a narrow metric set, documented sources, consistent collection methods, and a clear route from performance gap to assigned action. In fast-moving markets, you also need to know which signals remain stable long enough to compare and which require continuous monitoring.
Table of Contents
- The Hidden Power of Competitor Benchmarking
- Defining Your Benchmarking Goals and Scope
- Selecting the Right Metrics and Data Sources
- Collecting and Organizing Competitor Data
- Analyzing Data and Identifying Actionable Insights
- Implementing Changes and Monitoring Progress
The Hidden Power of Competitor Benchmarking
Xerox offers one of the clearest historical warnings about ignoring competitive performance. The company formalized systematic benchmarking in 1979, after its copier market share fell from 86% in 1974 to 17% by 1984, while profits declined from about $1 billion to $290 million. Xerox also discovered that competitors' manufacturing costs were only 40% to 50% of its own, a gap that made the competitive problem concrete rather than anecdotal. These figures and the broader case are documented in this account of Xerox's competitive benchmarking.
The lesson isn't that every company should copy the market leader. Xerox used comparison to identify specific process and cost differences, then converted those findings into operational changes. Benchmarking worked because the company compared itself against relevant competitors, isolated measurable deltas, and treated improvement as an ongoing discipline.

Benchmarking is not imitation
A weak benchmarking exercise asks, “What are competitors doing?” A useful one asks, “Where are we underperforming relative to comparable alternatives, and what can we change?”
That distinction matters in digital products. A rival may publish more content, run more advertising, or collect more followers, yet still fail to earn the trust signals that influence purchase decisions. Raw activity can create a misleading picture. The job is to connect visible activity with outcomes such as demand capture, conversion quality, customer perception, pricing power, or AI citation coverage.
Teams also need to separate competitive intelligence from broader market observation. The practical difference is explained in this guide to competitive intelligence versus market research. The distinction helps prevent a common failure: collecting interesting information without defining how it will affect a decision.
The operating principle
Competitive benchmarking has been used in management practice since at least the 1980s, developing alongside Total Quality Management and process reengineering before expanding with wider access to digital data and syndicated sources in the 1990s and 2000s. Its foundational process is iterative: identify useful activities, map the process, collect and organize data, analyze it, identify best practices, secure implementation support, and monitor results. The history and process are summarized in this overview of competitive benchmarking.
For digital teams, the same logic now applies to AI visibility. A brand's position isn't defined only by where it ranks in search results. It also depends on whether assistants understand its product, which sources they trust, how competitors are described, and whether those answers change when the prompt or provider changes.
If your benchmark can't show what changed, why it changed, and who owns the response, it isn't a management tool. It's market-themed decoration. For teams exploring financial-sector comparisons, data-driven bank benchmarking provides useful context for how structured comparisons can support decisions in a regulated market.
Defining Your Benchmarking Goals and Scope
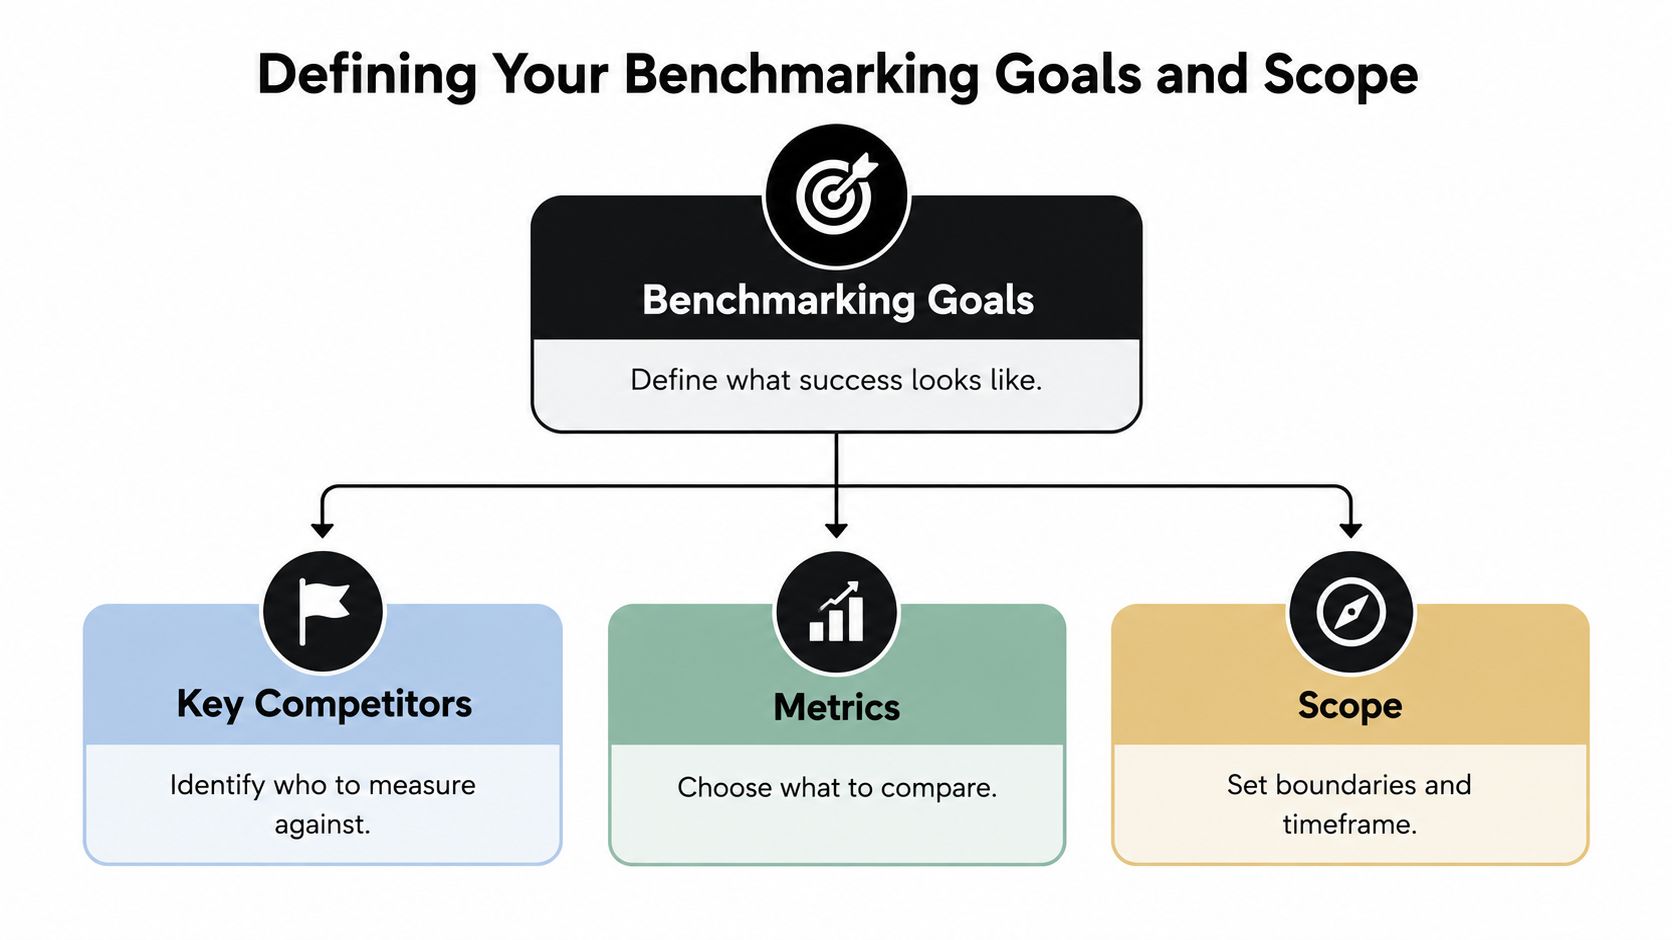
Start with a decision, not a dataset. “Benchmark our competitors” is too broad to guide collection or analysis. A better question might be, “Why do competitors appear more often in high-intent product comparisons?” or “Where does our pricing and packaging create friction against direct alternatives?”
Your question determines the scope. If the issue is positioning, you may need messaging, proof points, review language, search presence, and AI descriptions. If the issue is pricing, you need packaging architecture, entry requirements, feature restrictions, discount patterns, and perceived value. Mixing every available metric into one scorecard makes the answer harder to trust.
Build a defensible peer set
A practical benchmark starts with 3–5 real competitors, according to the workflow described in this competitor benchmarking guide. Include companies that compete for the same buyer and solve a similar problem, but don't stop there automatically. An indirect alternative may capture the same demand with a different product model, while an emerging entrant may change customer expectations before it becomes a conventional competitor.
Classify each peer by role:
- Direct competitor: Offers a comparable product to a similar audience.
- Indirect competitor: Solves the same need through a different approach.
- Emerging competitor: Introduces a new experience, category frame, or distribution model.
- Substitute: Competes for the buyer's budget without resembling your product.
Keep the set stable for the benchmark cycle. Add or remove a company only when the reason is documented. Otherwise, shifting the peer group can make apparent performance changes reflect a new comparison set rather than real movement.
Set boundaries before collecting data
Define the geography, customer segment, time period, currency, and estimation method in writing. Comparisons become unreliable when one competitor is evaluated globally, another locally, and a third through a different reporting period. The same problem appears when one value is measured directly while another is inferred from a model and both are displayed with equal confidence.
Choose 5–8 repeatable metrics tied to the original decision. Assign every metric a named source, owner, definition, and refresh cadence. Build one complete baseline before scoring competitors, then normalize mixed measures onto a common scale such as 0–5 or percentiles, as recommended in the cited workflow.
Practical rule: If you can't explain how a metric will be collected again, don't make it part of the benchmark.
A baseline should also include qualitative evidence. Capture the exact page, prompt, review context, or pricing condition behind an observation. That source-level record lets a team investigate the gap later instead of arguing over a score detached from its evidence.
Selecting the Right Metrics and Data Sources
Metric selection is where most benchmarking projects lose their usefulness. Teams often choose what is easy to see, such as follower counts, visible publishing volume, or broad traffic estimates. Those signals can provide context, but they rarely explain why one competitor wins a buyer or appears more frequently in an AI-generated recommendation.
Use a layered scorecard. Traditional digital metrics describe discoverability and demand capture. Commercial metrics describe the offer. Customer and AI metrics help explain trust, relevance, and machine-readable authority.
| Metric Category | Example Metric | Data Source |
|---|---|---|
| Search visibility | Ranking presence for a defined query set | Search results collected under consistent location and device conditions |
| Content coverage | Coverage of buyer questions and comparison topics | Competitor content inventories and page reviews |
| Authority signals | Relevant referring domains and cited resources | Backlink databases, partner pages, reviews, and documentation |
| Offer structure | Plans, feature access, packaging logic, and price presentation | Public pricing and product pages |
| Customer perception | Repeated themes in reviews and public feedback | Review platforms, community discussions, and customer research |
| AI visibility | Mentions, relative position, descriptions, and cited sources in assistant answers | Repeated prompt tests across supported AI providers |
| Conversion evidence | Your own landing-page and funnel outcomes | First-party analytics and CRM data |
Separate visibility from explainability
A brand may rank well and still be poorly understood by an assistant. Conversely, it may have modest classical SEO visibility but appear in AI answers because product documentation, partner pages, reviews, or help content clearly support its claims.
That makes source-level data more valuable than a single visibility score. Record which URLs or source types appear in answers, what claim each source supports, and whether the source is controlled by your team or by a third party. A competitor's citation advantage may reveal a documentation gap, a review deficit, a missing comparison page, or a trust problem rather than a need for more generic blog content.
For large catalogs and marketplaces, external data collection can require a different methodology from SaaS research. A resource such as Scrapeway's marketplace scraping benchmark offers relevant context for thinking about repeatable extraction from public marketplace environments. The source isn't automatically comparable to your own dataset, so document its scope and limitations before using it.
Favor reproducibility over volume
A narrow metric set beats a sprawling dashboard that nobody can refresh. Standardize query wording, provider, location, language, date, device, and interpretation rules. Label every value as measured or modeled, and attach a confidence note where uncertainty exists.
Your dashboard should make the measurement logic visible. A competitive intelligence dashboard can help organize these inputs, but the interface won't fix weak definitions. Start with metric discipline, then choose the reporting layer that makes decisions easier.
Collecting and Organizing Competitor Data
Collection quality depends more on consistency than on automation. Manual research is often the right starting point because it forces the team to define what counts as evidence. Automation becomes valuable after those definitions are stable and the collection task repeats often enough to justify it.
Begin with a source register. Give each metric a row containing its definition, source, collection method, date, owner, geography, time period, and confidence. Store the underlying evidence, not just the resulting score. A screenshot, URL, prompt, page capture, review excerpt, or structured export lets another person reproduce the observation.

Use a collection protocol
Write the protocol before the first full run. For search, specify the query set and location. For pricing, record the plan, billing condition, included features, limits, and visible discounts. For reviews, define the platforms, date range, sample rules, and themes. For AI visibility, preserve the exact prompt, provider, response, cited sources, and interpretation.
AI answers require particular care because outputs can vary with wording and context. Run the same buyer-intent prompts across competitors and providers, then distinguish a true visibility change from a prompt or provider effect. Record whether the assistant mentioned the brand, how it described the product, where it placed the brand relative to alternatives, and which sources appeared to support the answer.
Data discipline: Never overwrite an old observation when a new value arrives. Add the new record, preserve the previous one, and note the collection conditions.
Choose the right balance of manual and automated work
Manual review works well for nuanced interpretation, page-level source checks, and validating a new metric. Automated collection works better for recurring prompts, structured pricing fields, repeated search checks, alerting, and trend storage. The most reliable workflow combines both: machines gather consistently, while people review ambiguity and investigate meaningful changes.
Keep raw data separate from calculated scores. Store normalized values in a reporting layer, but retain the original fields so you can revise the scoring model without recollecting everything. This also prevents a common mistake, where a team changes the formula and loses the ability to explain how earlier scores were produced.
Pricing deserves its own audit trail because plans change without always changing the headline offer. Track packaging, feature gates, usage limits, sales requirements, and promotional language. A dedicated workflow for tracking competitor pricing can complement the wider benchmark, provided the same definitions and refresh rules remain in place.
This video can provide an additional visual reference for organizing competitive intelligence workflows:
Analyzing Data and Identifying Actionable Insights
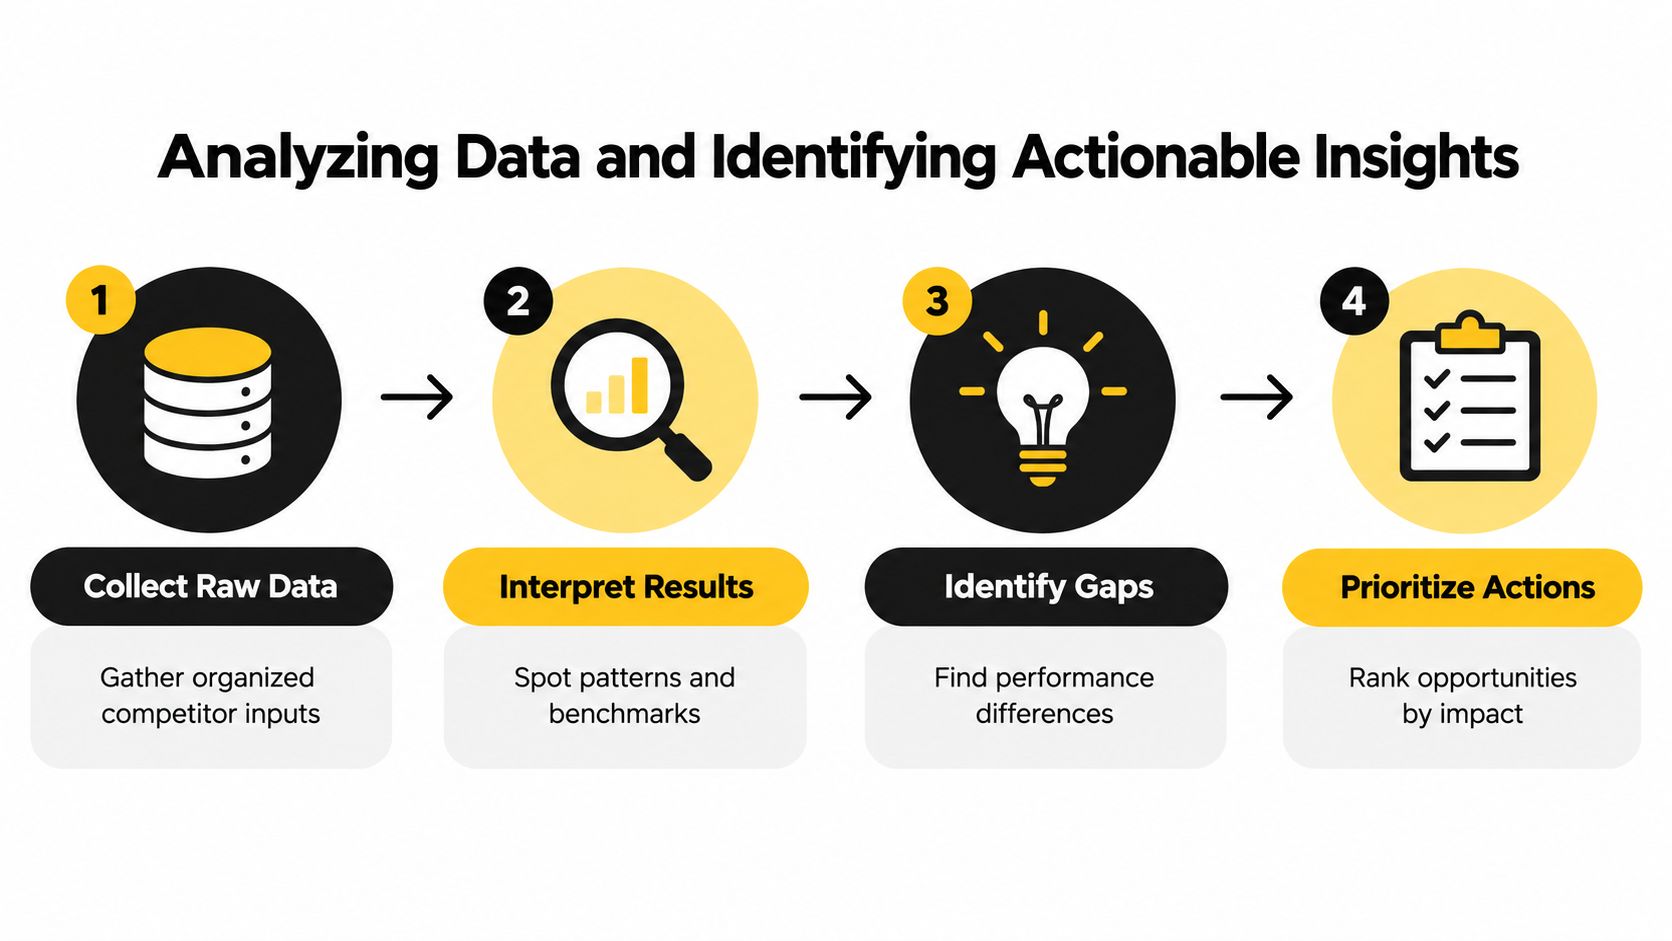
A benchmark becomes valuable when it changes a decision. Start by comparing each metric against the same peer set and measurement conditions, then look for patterns across categories. A weak result in one column may be noise. A consistent gap across search visibility, source coverage, customer perception, and conversion evidence points to a more credible strategic problem.
Don't rank every gap by size alone. Prioritize using three questions:
- Does the gap affect a defined business objective?
- Can the team influence the underlying cause?
- Can the change be tested and observed through the benchmark?
Diagnose the cause beneath the score
Suppose a competitor appears more often in product-comparison prompts. The score alone doesn't tell you what to fix. Review the answer and its citations. The competitor may have clearer feature documentation, stronger independent reviews, more partner references, or pages that explain use cases in language assistants can connect to the prompt.
That diagnosis leads to different actions. A documentation problem belongs with product marketing or customer education. A review-footprint problem may require customer advocacy. A weak comparison page may sit with SEO and content. A misleading product description may require positioning or UX changes.
The same method applies to traditional search. A ranking gap can result from topic coverage, technical accessibility, internal linking, intent mismatch, weak evidence, or an incomparable query set. Don't assign a content brief until the evidence supports a content diagnosis.
Turn patterns into an ownership map
Use a simple action register with these fields:
- Gap: What differs from the chosen peers?
- Evidence: Which source, prompt, page, or observation supports it?
- Hypothesis: Why might the difference exist?
- Action: What specific change will address the hypothesis?
- Owner: Which person or team is responsible?
- Validation: Which metric will show whether the action helped?
- Review date: When will the team reassess the evidence?
For share-of-voice work, a share of voice calculator can help turn scattered visibility observations into a comparable view. Treat the result as a directional signal unless the query set, competitors, geography, and collection method remain consistent.
The useful output isn't “competitor B leads.” It's “competitor B leads for this audience, on these prompts or topics, because these sources support this claim.”
Visualize the benchmark so stakeholders can see both relative position and confidence. A heat map can expose category-level gaps, while a source table explains what to change. Avoid a single composite score unless leaders understand how its weights were chosen. A polished score can hide uncertain data and encourage false precision.
Implementing Changes and Monitoring Progress
Benchmarking fails when the report lands in a strategy folder and nobody owns the response. Every material gap should become a decision, an experiment, or a deliberate choice not to act. Assign an owner, define the expected evidence of movement, and set a review point before implementation begins.
A static benchmark is especially risky in digital markets. Pricing changes, product launches, new reviews, search-result volatility, and AI answer changes can invalidate an old comparison before the next formal review. Recent practitioner guidance recommends refreshing digital metrics monthly and strategic metrics quarterly, with continuous monitoring between deeper benchmark reviews. That cadence and the problem of fragmented, unreliable competitor data are discussed in this guide to keeping competitive benchmarks current.
Match cadence to signal speed
Not every metric deserves the same frequency.
- Fast signals: AI mentions, cited sources, visible pricing changes, campaign activity, and major search-result shifts need lightweight monitoring.
- Medium-speed signals: Content coverage, review themes, landing-page changes, and query-set visibility can support regular trend reviews.
- Slow signals: Positioning, packaging strategy, customer perception, and segment strength need deeper interpretation rather than constant score changes.
This approach prevents two opposite mistakes. Checking everything continuously creates noise and wastes attention. Checking everything quarterly can miss a change that affects current demand.
Treat AI visibility as a live competitive channel
Traditional benchmarking tools were designed around search engines, while AI search introduces a different observation problem. Teams must compare not only whether a competitor appears, but also how an assistant describes the competitor, which sources it cites, and whether the answer changes across providers.
A cross-provider workspace such as MyMentions AI competitor analysis tools can support prompt-level comparisons, visibility and position tracking, sentiment signals, citation-source analysis, and alerts. Use those outputs as inputs to a broader operating process, not as a replacement for human review.
Close each cycle by asking whether the gap narrowed, whether the underlying source improved, and whether the change affected the intended business outcome. If the metric moved but the source-level problem remains, the team may have optimized the measurement rather than the market position.
MyMentions helps teams compare how AI assistants discover, rank, describe, and cite their products against competitors across recurring buyer-intent prompts. Visit MyMentions to connect cross-provider visibility data with citation sources, prioritized content and trust fixes, alerts, and stakeholder-ready reporting.