Competitive Benchmarking UX: A Practical 2026 Guide
Competitive benchmarking UX with shared tasks, clear KPIs, sample-size rules, and a method to turn gaps into prioritized fixes.
With only 10 participants, an observed task-success rate can plausibly range from 26% to 74%, according to a recent benchmark explainer on building a UX benchmark you can track over years. That single fact should change how you read most competitor leaderboards. A tidy ranking built from a handful of sessions isn't evidence. It's sampling noise dressed as a decision.
Competitive benchmarking UX works when you do the opposite of what most scorecards do. You pick a small set of buyer journeys, run them the same way on your product and on two or three real rivals, and refuse to rank anything until the tasks, participants, devices, and scoring rules match. A large scorecard feels thorough. It usually just gives you more incomparable numbers to argue about.
I would rather have four metrics I can defend than twenty I can't. If someone can't tell you who attempted the task, what counted as success, and how wide the uncertainty is, don't let that score move your roadmap.
Table of Contents
- Metrics Worth Scoring Before You Recruit
- How to Run Identical Tasks Across Competitors
- Tools and Templates for a Repeatable Benchmark
- When a Competitor Gap Is Large Enough to Act
- Accessibility Tests That Predict Real Choice
- Ship the Fix Backlog From the Benchmark
Metrics Worth Scoring Before You Recruit
Start with the scorecard, not the recruiting brief. Competitive benchmarking UX compares the same buyer journeys on your product and chosen rivals, with rules fixed before anyone sees a session. If you recruit first and invent scoring later, you'll bend the rubric around whatever happened in the room.
Limit the study to three to five journeys that a buyer uses to judge you. Finding pricing, judging whether a feature fits a real job, and completing signup are strong candidates for most SaaS products. Each journey needs an explicit start state and an explicit success state, written in plain language a second researcher could apply without asking you what you meant.
Why Task Success Anchors the Sheet
Task success earns the top row because it's the metric with the longest comparable history. Nielsen Norman Group's longitudinal account of its usability research reported that a broad usability study in 2004 found an average task-success rate of 66% on unfamiliar websites, and when the organization repeated the research across a larger set of sites in 2016, the average success rate had risen to 82%. That's a 16-percentage-point improvement over 12 years, about 1.3 percentage points per year, with failure falling from roughly one-third of attempts to approximately one-fifth.
Use those figures as context, not as a pass mark. They describe unfamiliar websites in broad studies, not your logged-in onboarding flow, your pricing page, or a specialist tool used by trained operators. A team that treats 82% as a universal target will celebrate or panic for the wrong reason.
Practical rule: Lock the success rubric before the first session. If partial completion can quietly become success during analysis, your benchmark is already broken.
Record four behavioral measures for every journey and every product. Binary task success tells you whether the person reached the predeclared end state. Median time on task shows efficiency without letting one stalled session drag the average. Error count captures wrong paths and failed inputs that the person had to recover from. Abandonment separates people who quit from people who finished slowly.
Keep satisfaction beside those numbers, not above them. A post-task rating can tell you how hard a journey felt, but it can't tell you whether the person finished. When you later want to compare website performance against benchmarks from Otter A/B, apply the same discipline. The comparison only means something if the underlying measures stayed stable.
Fill the Scorecard Before Anyone Is Recruited
| Metric | What to capture | How to score | What to report | Trap to avoid |
|---|---|---|---|---|
| Task success | Finished the predeclared success state | Binary pass or fail per participant | Percent success and the gap versus each rival | Counting partial completion as success |
| Time on task | Seconds from start state to success | Median, not the mean | Median for successful attempts, with abandoned attempts listed apart | Letting one stalled session pull the average |
| Errors | Wrong paths, failed inputs, repeated attempts | Count per participant per task | Errors per task and per product | Counting harmless exploration that the user recovers from |
| Abandonment | Stopped before the success state | Binary quit | Percent who quit, split from external interruptions | Treating a quit the same as a slow success |
| Industry context for unfamiliar sites | Historical average task success, not your target | 66 percent in 2004 and 82 percent in 2016 | Use only as context beside your own gaps | Treating 82 percent as a pass mark for a logged-in product |
Name the device mix you'll hold constant, and write it into the sheet. A desktop signup flow and a mobile signup flow aren't the same task just because the destination page shares a name. The same discipline applies when you think about the difference between sign tracking and goal tracking. You're deciding in advance what evidence counts, then refusing to move the goalposts when the results arrive.
One more decision belongs here. Write down how you'll code partial success. Say a participant finds the pricing page but can't identify which plan includes a required feature. That's useful diagnostic evidence, but it isn't success if your success state was naming the correct plan and price. Code it as a fail with a note, not as a generous pass.
How to Run Identical Tasks Across Competitors
A defensible study isn't complicated. It's just stubborn about equivalence. The visual below condenses the workflow into four moves, from picking real rivals to comparing numbers side by side.
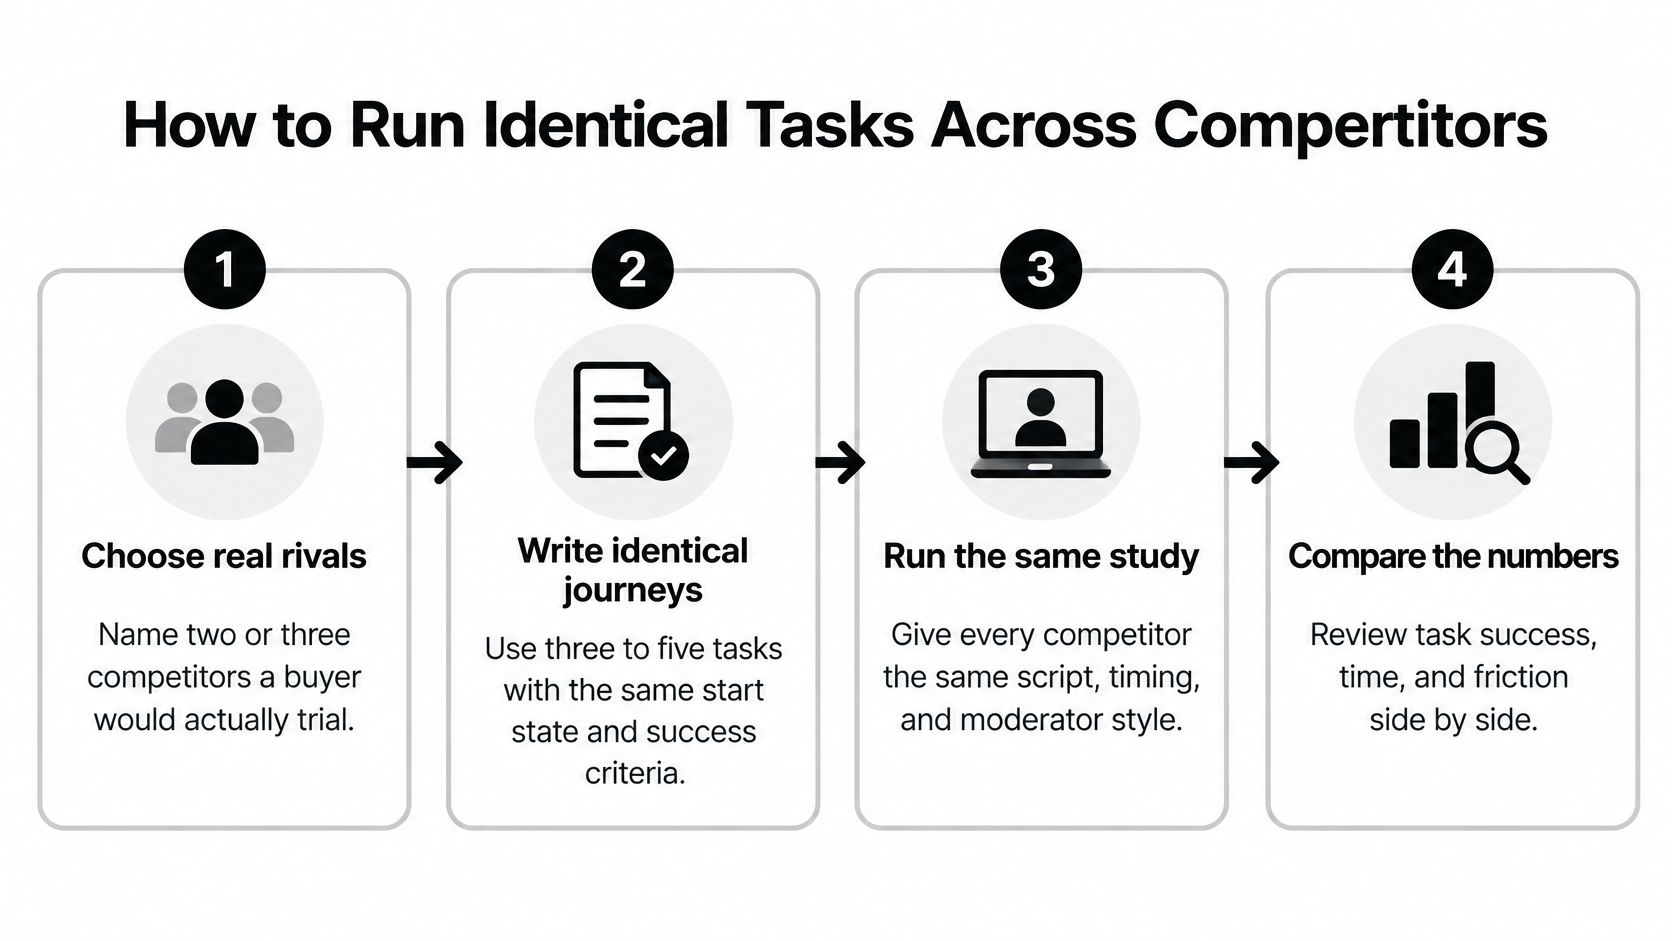
Work through these eight moves in order. Skipping the early ones makes the later numbers cheaper to collect and harder to trust.
- Name real rivals: Pick two or three products a buyer would trial this quarter. A long logo list dilutes your sample and produces shallow comparisons nobody acts on.
- Write identical journeys: Use the same start state, success state, and task wording on every product. Don't name the button, menu, or feature label in the task, because that wording won't match across rivals.
- Freeze the participant screen: Fix the market, device mix, and the split between novice and experienced users before recruiting. Segment results by those groups instead of blending them into one average.
- Randomize product order: When one person sees more than one product, rotate the order so learning from the first attempt doesn't flatter whichever product comes second.
- Declare the rubric: Write what counts as success, what counts as partial success, and what counts as an error. Do this before the first session, not during the debrief.
- Run and log behavior: Capture binary success, time on task, error count, abandonment, and a short post-task difficulty rating for every attempt.
- Report absolutes and gaps: Show each product's own result and the gap versus each rival. A gap without the underlying rates hides whether both products are good, both are bad, or one is failing outright.
- Preserve the setup for the next wave: Keep task wording, screening criteria, device mix, and scoring rules identical. Change any of them and you can't tell improvement from methodological drift.
Sample Size Is Where Most Studies Quit Too Early
Nielsen Norman Group's guidance on benchmarking UX illustrates the decision value of a completion-rate comparison of 86% for one product versus 62% for a competitor. A gap that size can change a roadmap. A two-point gap usually can't, and it shouldn't.
The same guidance puts competitive studies at approximately 150 to 300 participants per website in between-subjects designs, where each participant tests one product. That's the scale you need when small differences carry real money. A smaller within-subjects round, where the same people try several products, can point at problems and generate hypotheses. It isn't safe for interpreting small differences, so don't present it as if it were.
Run a power analysis before recruitment, based on the smallest gap you'd act on. If a five-point signup gap wouldn't change your priorities, don't pay to detect five points. If it would, budget for the sample that can detect it. Teams that skip this step end up with a study sized by habit rather than by the decision in front of them, much like teams that rush product discovery techniques without deciding what evidence would change the plan.
The short video below walks through the practical setup, so watch it with your own task scripts open and check each journey against the equivalence rules above.
Three Traps That Invalidate the Whole Sheet
Unequal task difficulty is the most common one. If your product requires account creation before pricing and a rival shows pricing publicly, you aren't measuring the same journey anymore. Either redefine the journey so both can complete it, or report the structural difference as a finding instead of pretending the times are comparable.
Uneven prior familiarity comes next. A participant who already uses a rival daily will finish faster for reasons that have nothing to do with your design. Screen for familiarity, balance it across products, or analyze experienced users separately.
Folding partial success into success is the quietest way to flatter a weak flow. Code what happened, not what you hoped happened.
Say you test a feature-evaluation journey for a reporting tool. The success state is finding whether scheduled exports exist and naming the plan that includes them. A participant who finds the exports page but picks the wrong plan hasn't succeeded. That's a fail with a valuable note attached, and that note is often where the fix lives.
Tools and Templates for a Repeatable Benchmark
You don't need a large stack. You need four things that each do one job, plus a template that survives staff changes and quarterly reprioritization. The checklist below groups the kit and the repeatable setup.
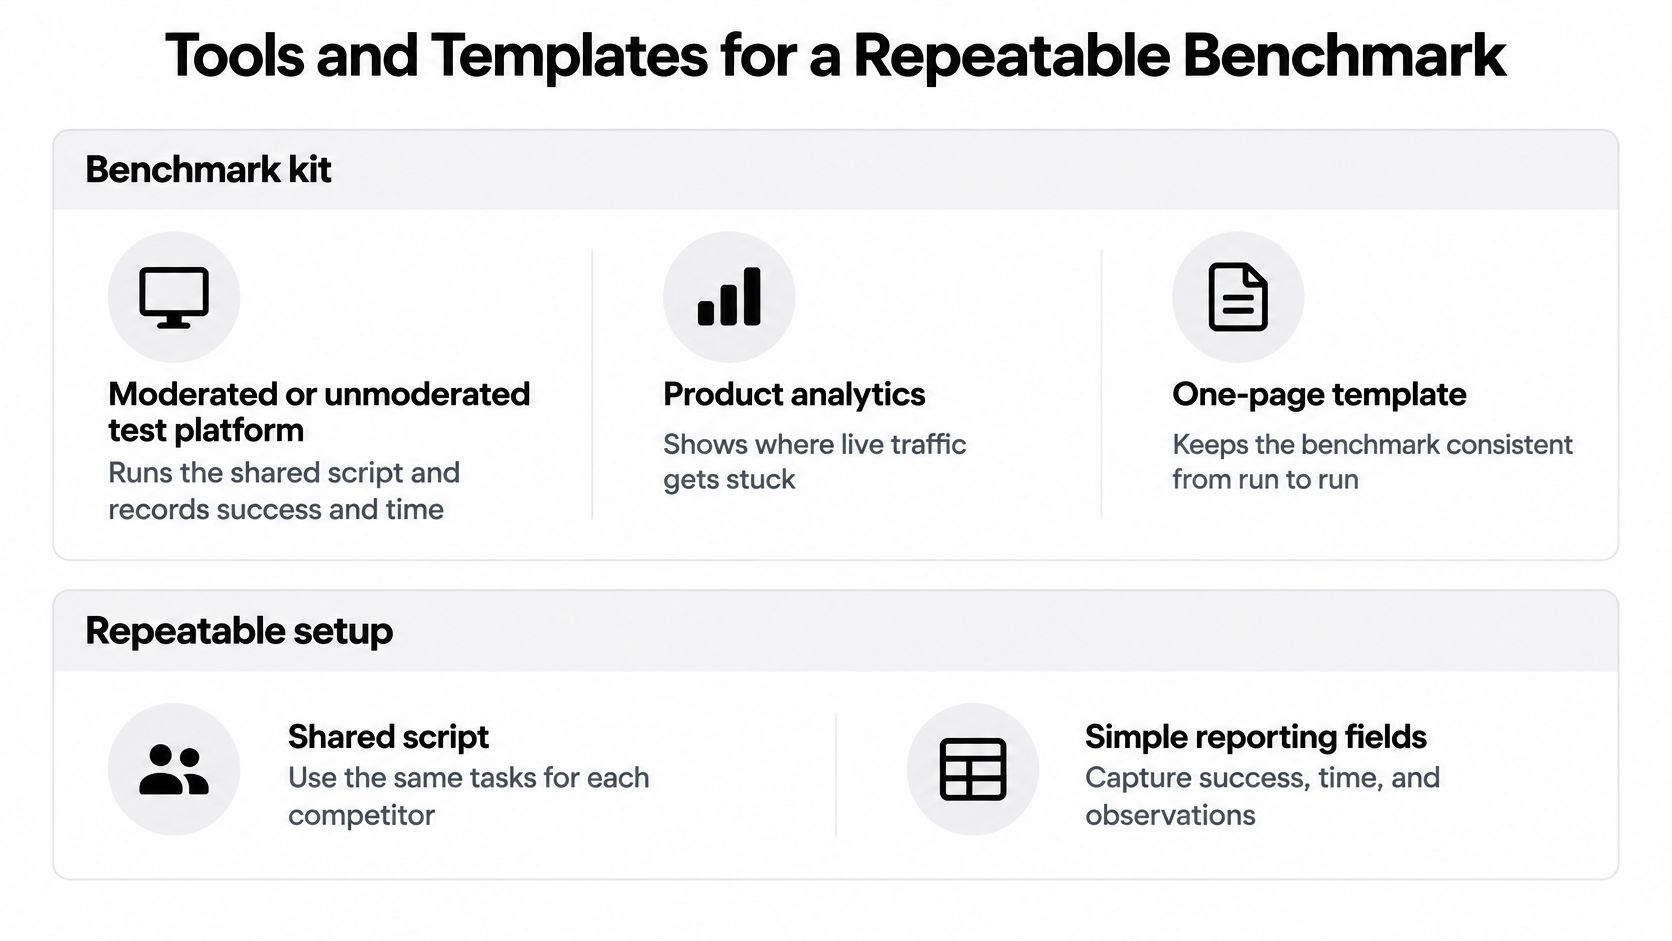
A moderated or unmoderated test platform such as UserTesting, Maze, or Lyssna runs the shared script and records success and time. Pick based on whether you need to probe failures live. Moderated sessions cost more but let you ask why someone abandoned. Unmoderated sessions scale better when you need larger samples for a decision-grade gap.
Product analytics in a tool like Amplitude, Mixpanel, or GA4 shows where live traffic already drops on those same journeys. That tells you which tasks deserve a test in the first place. Don't benchmark a journey nobody attempts just because a rival does it well.
What Each Part of the Kit Is For
- Test platform: Runs the identical script, records sessions, and timestamps start and success states so time on task isn't estimated by hand.
- Product analytics: Shows real drop-off on your own journeys, which helps you choose tasks with commercial weight.
- Post-task survey: Captures difficulty or satisfaction immediately after behavior, while the attempt is still fresh. It never substitutes for observed completion.
- Spreadsheet or research repository: Holds the rubric, participant screen, and wave-over-wave scores in one place, in tools like Dovetail, Airtable, or a plain shared sheet.
Expert heuristic review fits before recruiting, not instead of it. A reviewer walking Nielsen's heuristics can flag likely violations cheaply and sharpen your task list. That review can't estimate a completion rate, because an expert isn't your buyer. Treat it as triage.
If your competitive question also covers how AI assistants describe your product, a visibility workspace such as MyMentions can sit beside the UX sheet. It tracks visibility, position, and sentiment across AI providers for buyer-intent prompts and shows which competitors get cited. Keep those results in a separate tab. They're useful for spotting trust and content gaps that might affect a journey, but folding an AI rank into a usability score mixes two different kinds of evidence. Verify anything that touches a journey with the task test itself, the same way you'd structure evidence in a competitive analysis deck rather than collapsing it into one slide number.
The One-Page Template
| Template block | What to write | Example entry |
|---|---|---|
| Journey and success state | Journey name, start state, and the exact success state | Find pricing: plan price visible on the pricing page |
| Competitor and device | Rival name, device, and participant segment, held constant across waves | Rival name; desktop; novice buyers |
| Metric values | Task success %, median time on task, errors, abandonment, post-task difficulty | Success %, median seconds, errors per task, quit % |
| Gap versus your product | Absolute gap per metric against each rival, with its confidence interval | Success gap in points, with interval shown |
| Equivalence notes | Anything that broke task, sample or device equivalence and forces a rerun | Different device mix: rerun before ranking |
Archive four artifacts with every wave: the script, the participant screen, the scoring rules, and the raw task-level results. Without the raw results, you can't recompute intervals or check a coding dispute later. Without the screen, next quarter's sample drifts and your trend line becomes fiction.
When a Competitor Gap Is Large Enough to Act
Ranking products from a handful of sessions is the most expensive mistake in competitive benchmarking UX, because it sends design and engineering after noise. The explainer cited in the opening makes precise competitor rankings unreliable at tiny samples, yet teams still publish league tables from eight or ten people per product. Don't.
Use small samples for what they're good at. Qualitative work with 10 to 20 participants shows where and why people fail, which is exactly what you need to fix friction. Roughly 30 to 40 participants can support an early quantitative read. Neither replaces a larger between-subjects plan when the decision is expensive. Those sample bands come from the same benchmark explainer on tracking a UX benchmark over years, which recommends roughly 30 to 40 participants for quantitative benchmarking and 10 to 20 for qualitative work.
Read the Interval Before You Read the Gap
Report every task-level gap with a confidence interval, the participant mix, and the task script. A percentage without those three things can't be checked, replicated, or compared next wave. If a stakeholder asks why the interval matters, show them the arithmetic on a small sample.
For example, say 8 successes in 10 attempts gives a Wilson 95 percent interval of about 49 to 94 percent. That range is so wide it can't separate your product from a rival performing far better or far worse. The observed rate looks precise. It isn't.
Decision rule: Act only when a gap is larger than sampling error and larger than a practical threshold you wrote down before looking at the data.
That practical threshold should be tied to money or activation, not to pride. A failed signup step that costs completed accounts clears the bar quickly. A settings page that takes a few seconds longer probably doesn't, unless your buyers hit it constantly. Write the threshold into the study plan so nobody invents it after seeing an embarrassing result. This is the same discipline that separates real competitive intelligence analysis from a spreadsheet of rival screenshots.
| What you have | What it can mean | What to do |
|---|---|---|
| About 10 participants | Observed success can plausibly span 26 percent to 74 percent | Do not rank products |
| 10 to 20 participants, qualitative | Where and why people fail | Fix the observed friction, do not publish a league table |
| About 30 to 40 participants | An early quantitative range | Treat it as directional and plan a larger wave if the stake is high |
| Gap inside the confidence interval | Sampling noise | Keep the script and collect another identical wave |
| Gap past sampling error and your pre-set practical threshold | A difference large enough to matter | Put that step on the fix backlog |
| Satisfaction lead with no success or time gap | Attitude without a behavioral difference | Diagnose the task instead of redesigning from the score |
| Different devices, segments, or success definitions | Numbers that are not comparable | Rerun before prioritizing |
Satisfaction Scores Don't Rescue a Weak Sample
Standardized scores help only when they sit next to behavior. A review of standardized usability questionnaires in Weave: Journal of Library User Experience describes SUS as providing a 1 to 100 global usability score, with 68 commonly treated as the average benchmark, and notes that UMUX validation research found standard deviations of roughly 15 to 20 points. A spread that wide means a small satisfaction lead over a rival may be noise rather than an advantage.
So don't average unlike journeys into one opaque UX number. Don't change scales between rivals. Don't crown a winner from an expert-only sample. If the devices, segments, or meaning of success differed between products, the honest move is a rerun, however annoying that is to announce.
More metrics don't fix any of this. A small set run consistently beats a large scorecard whose inputs can't be compared, because comparability is the whole product of a benchmark.
Accessibility Tests That Predict Real Choice
An accessibility scan can flag a barrier, but it cannot tell you whether someone can complete a purchase. Compare task outcomes across equivalent journeys, using a small set of measures consistently: completion, error recovery, time, and confidence.
Automated scans offer a starting point. Accessibility barriers appear across websites, including problems with contrast, alternative text, and form labels. Those findings can guide testing, but they do not establish whether a buyer can finish signup, whether a mobile app is accessible, or whether a barrier changes a purchase decision.
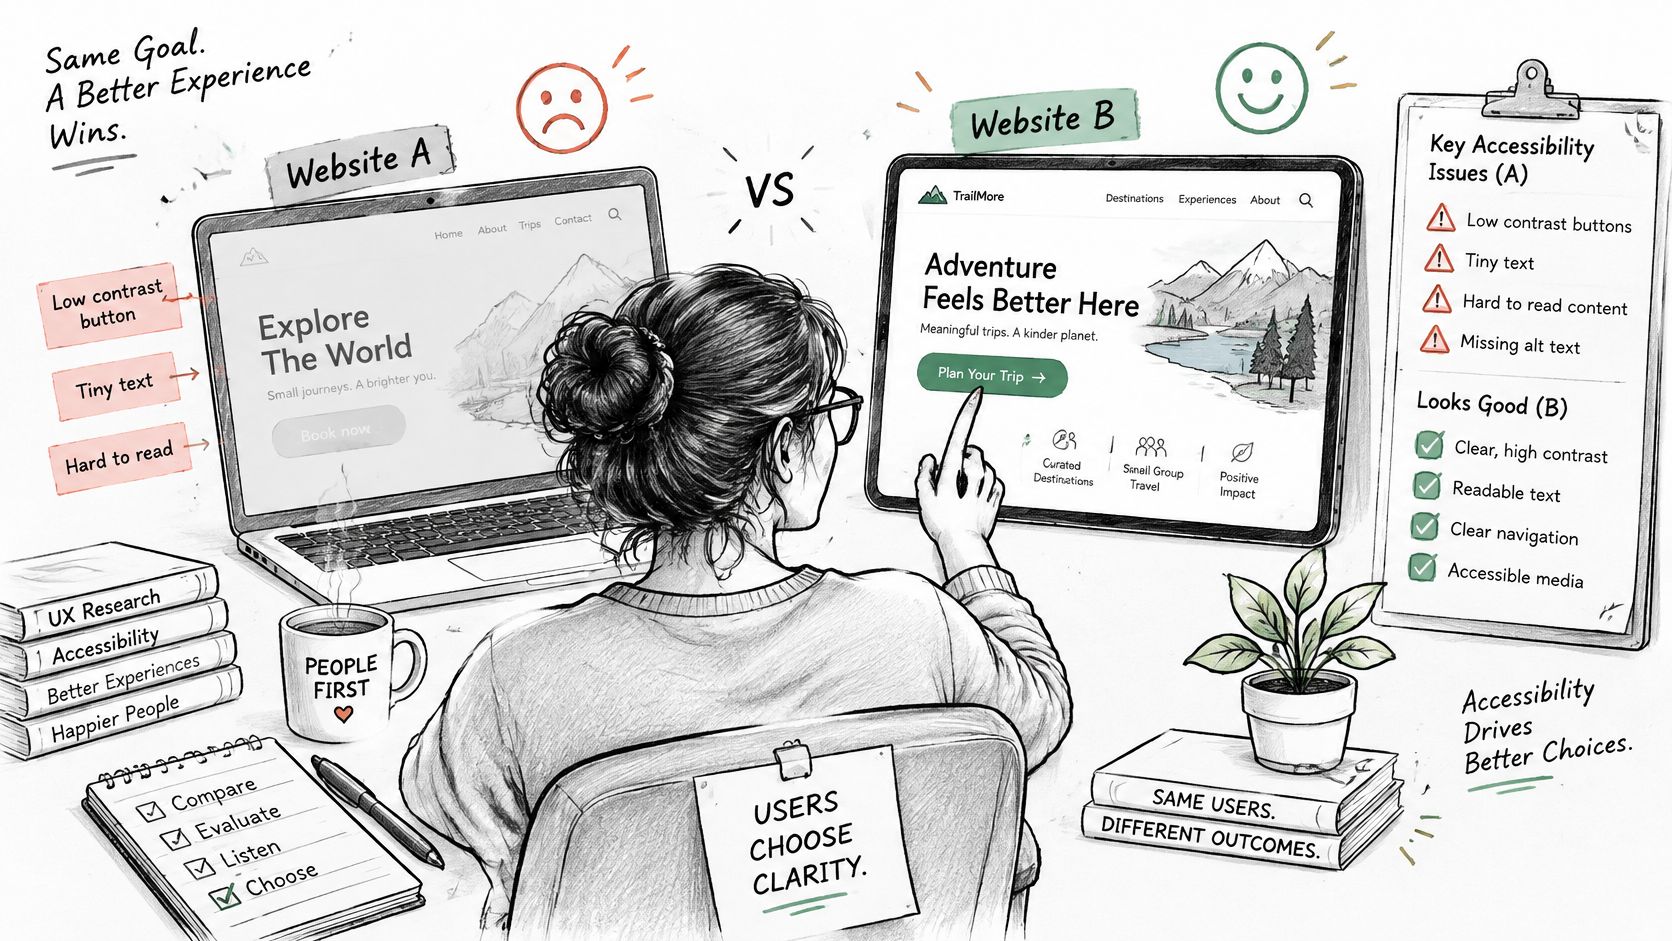
The image below contrasts an inaccessible experience with a design a person can use to complete a task.
Test the Journey, Not the Home Page
Use the same high-value journeys as the main study, with participants who use a screen reader, keyboard only, or zoom, and participants who need clearer language or fewer simultaneous demands. Apply the same success rubric across competitors. Record completion, error recovery, time, and confidence for each attempt.
Track recovery separately from eventual completion. A screen-reader user may not hear which form field caused an error, while a sighted mouse user may spot a visual highlight. If both eventually submit the form, a simple success count hides the difference in effort and clarity.
- Seed the script with scans: Run axe, WAVE, or Lighthouse to locate contrast, alternative-text, and label issues. Build tasks that pass through those points.
- Recruit for the barrier: Match participants to the access need being tested. Asking nondisabled participants to unplug a mouse does not reproduce screen-reader use.
- Compare equivalent journeys: Compare checkout with checkout, not a checkout task with a home-page score.
- Report completion first: Show whether participants finished. Use violation counts to help diagnose barriers.
A barrier that blocks or badly slows a revenue task relative to a rival merits attention. For example, an unlabeled payment field that stops keyboard users, compared with a rival form they can complete using a screen reader, signals a competitive gap on a purchase task.
A lower automated violation count does not prove that a product is easier to use. Scans indicate possible conformance problems; task outcomes show whether participants with access needs can complete the journey. Do not claim that fewer violations increase conversion without conversion evidence.
Ship the Fix Backlog From the Benchmark
Keep only the gaps that survived the equivalence check and cleared the practical threshold you set before the study. Rank them by how often the journey drives revenue or activation, how large the gap is against the closest rival, and how much you trust the sample. A struggling signup step facing a rival that completes far more attempts outranks a settings screen that's slightly slower.
Write each backlog item with five fields: the failing step, the evidence with its confidence interval, the rival behavior worth copying or beating, the metric that will show the fix worked, and the reread date. An item missing the reread date is an opinion with a ticket number.
Document the wave so another team could replicate it. ISO's listing for ISO/IEC 25062 covers the Common Industry Format, published as ANSI/INCITS-354 in 2001 and approved internationally as ISO/IEC 25062 in 2005, with the 2006 edition formally published in April 2006. The standard specifies reporting usability test design, participant information, tasks, data-collection methods, and measures such as effectiveness, efficiency, and user satisfaction. Model your report on that structure and your results stay comparable across releases. A single overall UX score fails that test, just as vague SEO recommendations fail without the evidence behind them.
For the next 30 days, ship the first fix, then rerun the single money journey with the frozen script. Only expand to other journeys once that reread confirms the gap moved. Stakeholder exports should show three things per item: the journey gap, the fix, and the reread date.
Your UX benchmark tells you whether buyers can finish the journey once they arrive, and MyMentions shows whether AI assistants send them to you or to a rival in the first place, tracking visibility, position, sentiment, and share of voice across providers for the buyer-intent prompts your market asks. Run both on the same cadence and you'll spot trust and content gaps beside your task gaps, then verify the ones that matter with real users. Start comparing your AI visibility against competitors today at MyMentions.