The weekly leadership meeting starts the same way. Someone drops a screenshot into the channel. A competitor shows up in every AI-generated shortlist for your category, and the room wants a reason. Product points at content. Content points at product. Sales has three anecdotes and no shared sample. Nobody can say whether the assistant recommended that rival, merely mentioned it, or repeated an outdated claim.
That is how a competitive analysis deck fails before the first chart. It collects logos, feature rows, and a hopeful quadrant, then asks executives to invent the decision. A useful deck answers one question. Do you reposition, rebuild a capability, close a citation gap, correct how assistants describe you, arm sales, reprice a package, or fund a response? The eight formats below each serve a different decision.
Visuals only help when they compress evidence into a choice. A business-education synthesis citing Wharton and American Management Association findings reports that only about 50% of audiences found a purely verbal presentation convincing, compared with more than two-thirds when visuals were added, and that data visualizations could shorten business meetings by 24%, per Southern Oregon University's review of visualization practice. The same source cites a Forrester estimate that organizations leave 60% to 73% of their data unused because leaders lack resources to turn it into understandable information. Your deck is that translation.
Table of Contents
- 1. Competitive Positioning Matrix Deck
- 2. Weighted Feature and Capability Scorecard Deck
- 3. AI Visibility and Share-of-Voice Benchmark Deck
- 4. Citation Sources and Content Gap Deck
- 5. Competitor Messaging and AI Brand Perception Deck
- 6. Win-Loss Analysis and Competitive Battlecard Deck
- 7. Competitive Pricing, Packaging, and Total Cost Deck
- 8. Competitive Strategy and Prioritized Response Deck
- How the eight competitive analysis deck formats differ by purpose, core question, and structure
- Choose the Deck That Matches Your Next Decision
1. Competitive Positioning Matrix Deck
A positioning matrix is the fastest competitive analysis deck to scan, and the fastest one to lose the room. Teams pick axes like "innovation" and "customer love" so their logo lands in the attractive corner. Executives notice.
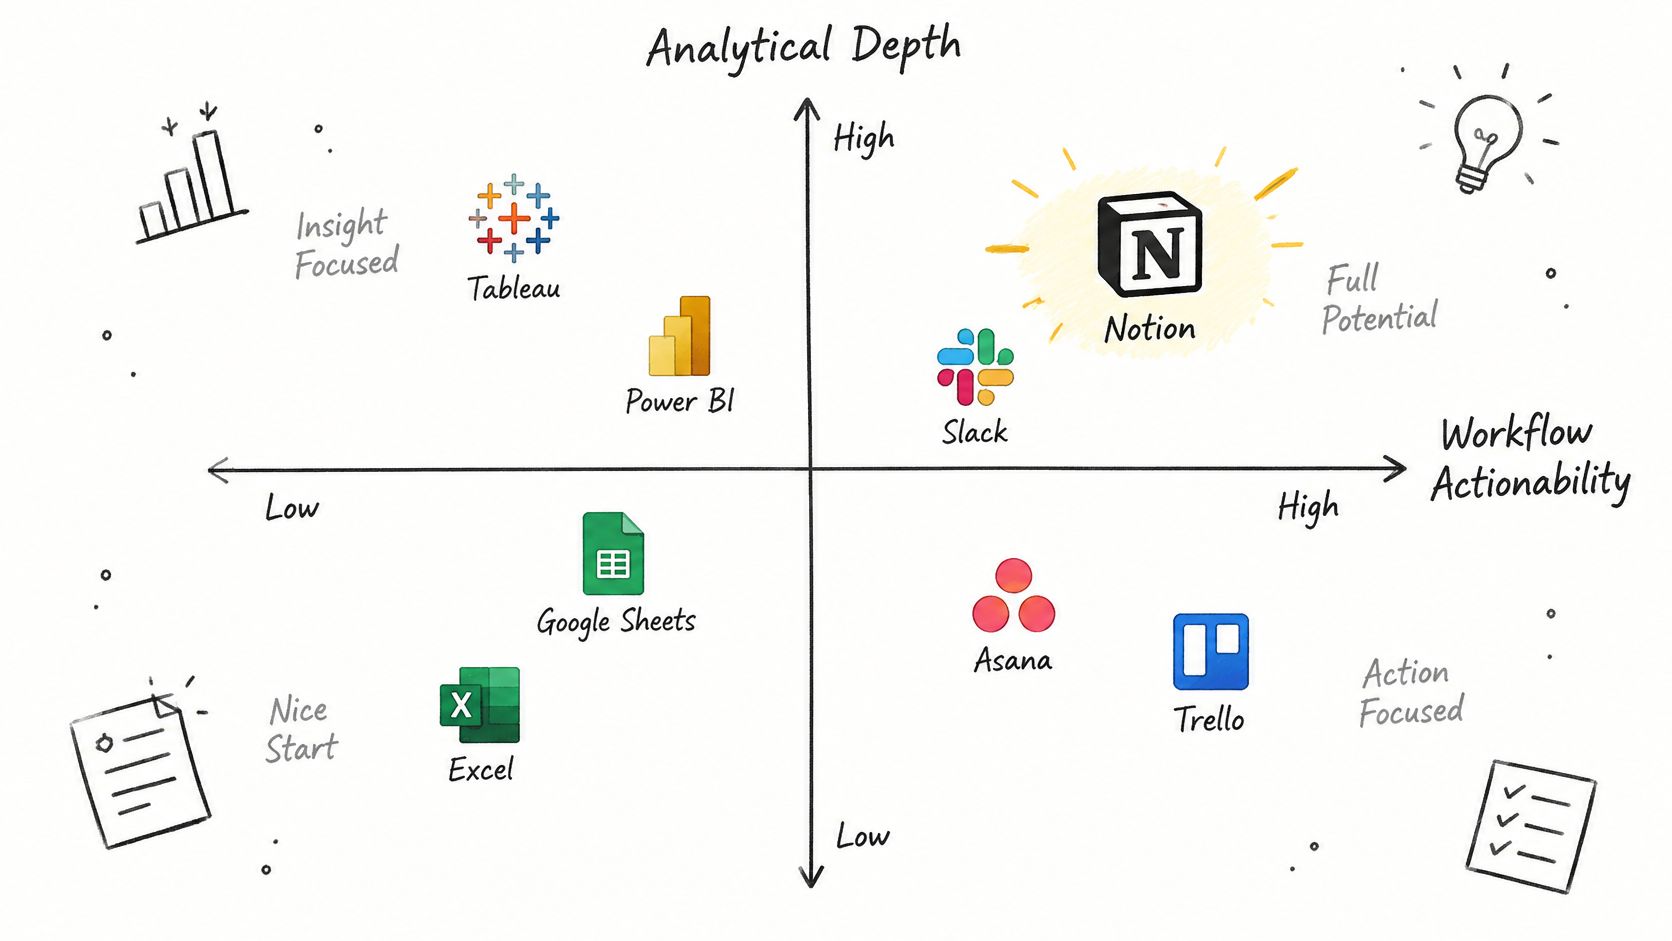
For a product such as MyMentions, the set is not "other SEO tools." It includes AI visibility analytics, traditional rank trackers, social listening platforms, and broad marketing suites. Buyers do not purchase a vague sense of quality. They buy reporting depth, provider coverage, and whether the output tells a marketer what to change.
A B2B benchmarking case standardized 12 direct and adjacent competitors on pricing, features, reach, and capability. A capability-versus-reach map then exposed one whitespace where nobody combined strong market reach with strong product depth, and a segment-level sizing view tested whether that gap was commercially real, as shown in this benchmarking case. The evidence chain mattered more than the picture: taxonomy, normalized fields, two-axis map, size check, one recommendation.
Choose Axes Buyers Already Argue About
Interview recent buyers before you freeze the axes. Put definitions and scoring rules in an appendix. When public proof is thin, plot a range instead of a false dot.
Practical rule: If you can tilt both axes so you always win, redraw them.
Compare reporting depth with how specific the recommended action is. A loud visibility score with no next step sits low on actionability. AdManage.ai's Smartly.io and Madgicx comparison shows the same discipline in another software category. Dimensions only persuade when they match how buyers choose.
2. Weighted Feature and Capability Scorecard Deck
A checklist that marks features present or absent flatters the vendor with the longest docs page. A weighted scorecard asks three harder questions. Does the capability exist, how well does it work, and how much does this buyer care?
Build the rows from a real buying job, not from your roadmap. For an AI visibility workspace, the requirements that usually move a decision are prompt organization, supported-provider coverage, competitor benchmarking, citation analysis, recommendations, reporting, alerts, and traffic attribution. Separate must-haves from weighted preferences. A missing must-have ends the comparison. A weak preference does not.
Test the Same Job, Not the Same Slogan
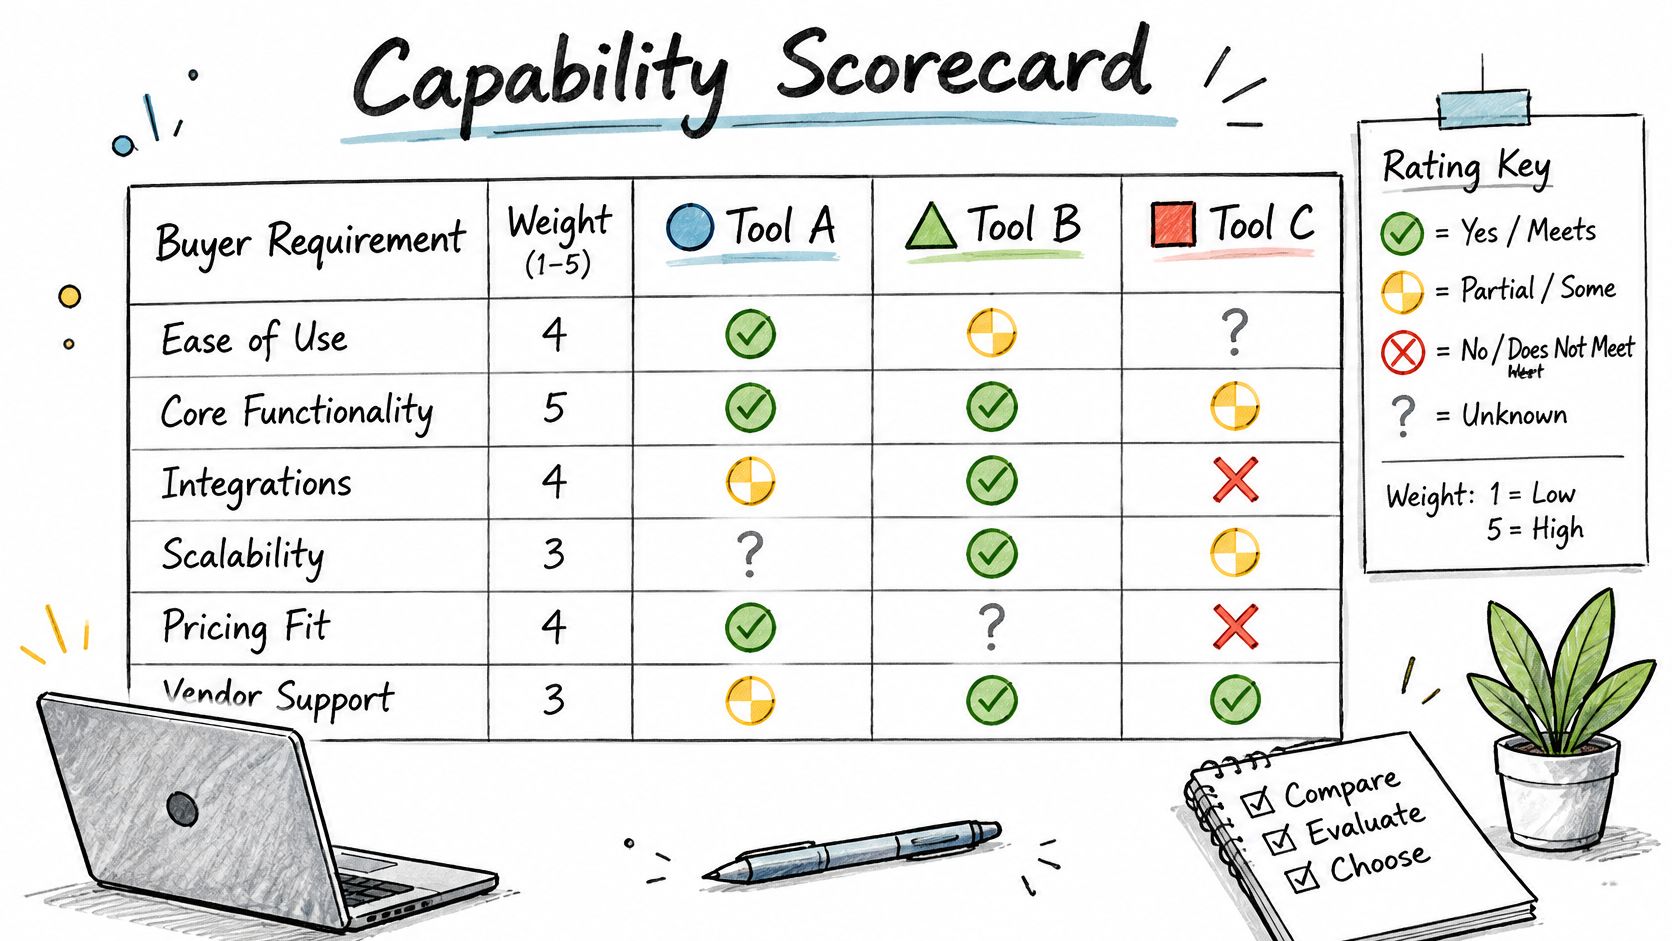
Run every vendor on the same plan level and the same test conditions. An undocumented capability is unknown, not absent. Include at least one task test, such as finding the citation sources behind a rival's visibility lead.
- Match the collection method: Confirm whether "supported providers" means a live assistant interface, an API response, or another capture path. Those are not equivalent.
- Score quality, not logos: A provider tile that returns stale or incomplete answers should not earn the same points as a monitored workflow.
- Show the weight: If citation analysis is 25% of the score and alerts are 5%, say so on the slide.
What fails is a 40-row grid with equal checkmarks. Executives cannot see the trade-off. What works is a short score, the two capabilities that created it, and the buyer segment those weights represent.
3. AI Visibility and Share-of-Voice Benchmark Deck
This format answers a narrower question than "who owns the market." It measures how often, and how prominently, brands appear in AI-generated answers for a defined set of buyer-intent prompts.
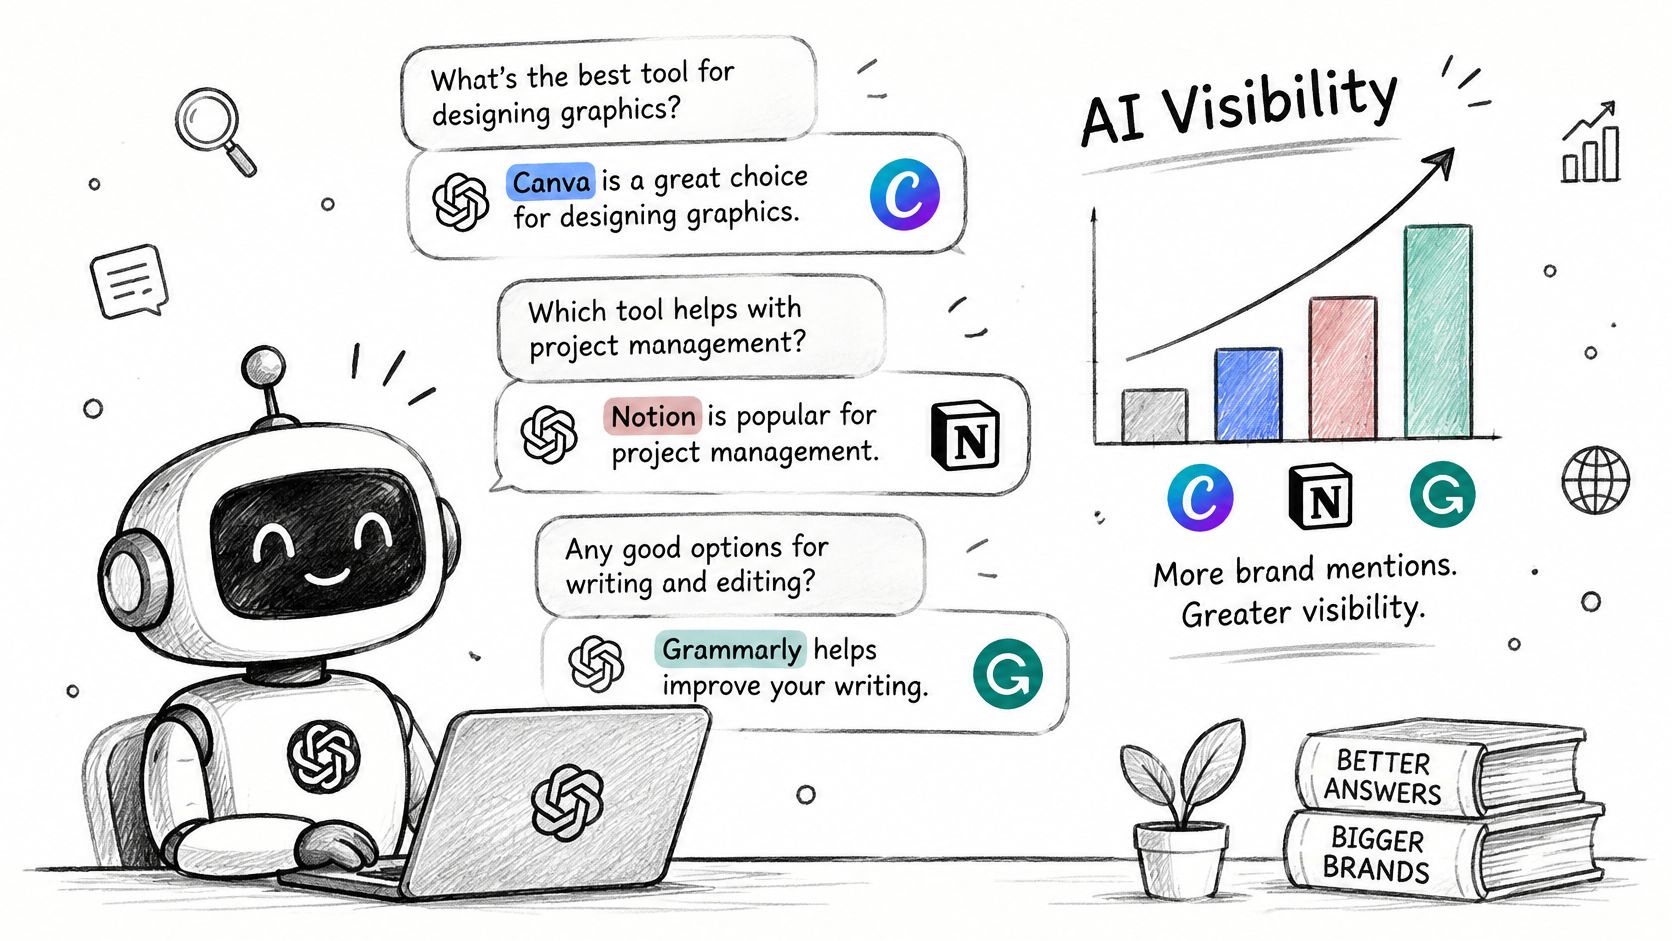
Treat the result as a measurement of that sample and collection method. It is not universal AI market share. Define share of voice in writing. One defensible version is your brand's mentions divided by all tracked-brand mentions in the sampled answers. Report mention rate separately, as the share of sampled answers that name the brand at all. State how you treat repeat mentions, ties, absent brands, and unranked recommendations. A share of voice calculator is useful only after those rules are fixed.
Keep a stable benchmark prompt set, and park exploratory prompts on a separate slide. Show sample size, collection dates, and variability. A single headline score hides a bad week.
One Ranking Hides the Context
A 2025 global survey of 2,237 recent online purchasers in the U.S., U.K., France, and Germany found that 48% cross-check AI answers across platforms, and a separate 2025 analysis of 6.8 million AI citations from 1.6 million responses tied source and brand appearance to user location, intent, and conversational context, according to Yext's AI archetypes research. A context matrix should show where each rival is discovered, recommended, cited, or described positively, and where systems disagree.
The slide below walks through how prompt-level visibility becomes a chart executives can challenge.
Consistency across assistants can matter more than winning one benchmark. If buyers verify answers on a second platform, conflicting pricing or product claims damage trust even when one system ranks you first.
4. Citation Sources and Content Gap Deck
Visibility without sources is a score. Visibility with sources is a work list. This competitive analysis deck lists which pages assistants cite when they answer questions in your market, then shows where a rival has coverage you lack.
Separate what you observed from why you think it happened. A cited review, docs page, partner profile, comparison article, or help article is evidence. A theory that "domain authority caused the mention" is a hypothesis, and it belongs in a labeled column. Open the cited pages. Check accuracy, freshness, and whether they answer the prompt.

Prioritize the Question, Not the Page Count
A team chasing fifty new URLs will publish filler. A team fixing the three high-intent prompts where a rival is cited and you are absent will change the narrative buyers see. Use explicit gap rules so "missing" means missing from the sampled answers, not missing from a wish list.
A citation shows that a source appeared. It does not reveal every factor behind the answer.
Improve factual product information, crawl access, and editorial usefulness. Do not manufacture endorsements. Then track two outcomes on a review date. Did the changed asset get cited later, and did the answer become more accurate? If neither moves, the gap was real and the fix was wrong. That is still a better slide than a content calendar with no measurement.
5. Competitor Messaging and AI Brand Perception Deck
A competitor can appear in an AI answer and still be described incorrectly. This deck compares how each brand presents itself, how customers describe it, and how AI assistants characterize it. Use the comparison when buyers encounter your brand in AI-generated answers and the wording could affect consideration.
Collect self-descriptions from current homepages, product pages, and positioning statements. Gather customer descriptions from a consistent sample of public reviews and customer interviews, recording the source and date. Then test the same buyer prompts across assistants and save the answers. Keep the prompt wording consistent so changes in characterization are easier to interpret.
Code the Sample, Including the Ugly Lines
Apply one rubric across brands, and manually check a sample of coded answers. A selective set of favorable quotes will not hold up when a sales leader sees the full response.
- Accuracy: Does the assistant describe the category, pricing model, and core workflow correctly?
- Sentiment: Is the tone positive, neutral, or negative, and which specific claim drives it?
- Recommendation strength: Is the brand suggested, merely listed, or discouraged?
- Fix: Which asset should address a material error, such as product documentation, a comparison page, or a clearer product explanation?
Use guidance on sharing competitive intelligence to present the findings with enough context for executives to judge the evidence. Separate factual errors from fair criticism, and prioritize fixes that affect how buyers understand the product. Tie sentiment analysis in marketing to specific claims and their sources. Correct false descriptions with clearer, substantiated information, rather than trying to suppress negative feedback.
6. Win-Loss Analysis and Competitive Battlecard Deck
When a sales call stalls on measurement trust or product coverage, the rep needs evidence tied to that objection, not a broad claim that the product is better. Build this deck from interviews, sales notes, evaluations, and lost-deal records. Its job is to show why buyers chose or rejected an option, then give sales a usable response.
In 2025, competitors were involved in 68% of sales opportunities, according to Crayon's State of Competitive Intelligence. Use that as a reason to examine contested deals systematically: compare wins and losses, record the alternative selected, and identify the deciding criteria. Start with 8 to 12 interviews across recent wins and losses, if the available customer pool allows. Treat that as a working sample, not a claim of statistical representativeness.
Build the Card from Deal Evidence
Use the same interview guide for both outcomes, and, where possible, have someone other than the deal owner conduct the interview. Ask what triggered the purchase, which criteria mattered, what nearly stopped the deal, and what evidence changed the buyer's view. For a visibility product, probe coverage, measurement trust, recommended actions, reporting, and price.
Code each loss reason with a consistent label, such as missing capability, unclear value, weak proof, or price. Review the labels against call notes and interview responses, then rank them by how often they recur. Map each common objection to a specific proof point, such as a product demonstration or customer result, and a discovery question that surfaces the issue early. The battlecard should include competitor fit, those objection-response pairs, proof of difference, and questions reps can use in conversation.
Date the card and name an owner, or it becomes folklore.
Refresh it when product changes or repeated deal evidence changes the response. A visual format can make sales collateral easier to scan, but the card succeeds only when its claims are supported and usable in a live conversation. Avoid “we are more actionable” without a buyer quote, a coded loss reason, or a question a rep can ask.
7. Competitive Pricing, Packaging, and Total Cost Deck
Headline subscription prices hide the workload. In AI visibility analytics, two products at a similar monthly fee can differ wildly in prompt volume, collection frequency, provider coverage, seats, history, exports, and the hours required to implement them. This deck normalizes cost around a representative customer job, not around the cheapest public tier.
Define the unit before you divide anything. A unique prompt is not the same as a repeated run, a provider combination, or a geographic variant. Compare equivalent measurement frequency and reporting needs. If a rival's price is unpublished, label the cell as an estimate or leave it blank. Filling the gap with a confident guess is how pricing decks get torn up in the meeting.
Show How the Bill Changes
Run a sensitivity view. What happens to cost when prompt volume doubles, or when a second team needs seats? That slide prevents a false win on the starter plan.
- Workload first: Pick one mid-market scenario and price every vendor against it.
- Scope the meter: Separate prompts, runs, providers, and regions so finance can audit the math.
- Name the labor: Implementation time and export limits are part of total cost.
You can track competitor pricing without pretending a scraped price page is a contract. What fails is a single "we are 30% cheaper" claim with no workload behind it. What works is a table of included measurement, a labeled estimate, and the point where your package becomes the expensive one.
8. Competitive Strategy and Prioritized Response Deck
A competitor gains visibility in AI answers for a prompt your buyers use, while your product has a stronger capability but weaker citations. The decision is whether to improve the evidence, change the message, or leave the gap alone. This deck turns positioning, buyer evidence, capability comparisons, and AI visibility into owned actions, each linked to a business decision.
Use SWOT to connect observations to action. In a B2B International competitive intelligence brief, a steam-management manufacturer translated threat research into sector opportunities, sales arguments, and counterarguments. For example, an opportunity was to make energy-efficiency benefits more visible with models that demonstrated them. That points to an action: equip sales and consultant conversations with those models and evidence. Record the observation, its SWOT category, the proposed response, and the owner.
Separate a Fix from a Bet
Score each initiative from 1 to 5 on customer impact, strategic fit, confidence in the evidence, and effort. For effort, 5 means low effort; for the other criteria, 5 means high. Add the four scores for a simple ranking, then discuss trade-offs rather than treating the total as a verdict. A prompt-level visibility gap with clear citations and a small content update might score high on impact and confidence, with low effort. A new product capability supported by weak buyer evidence may score high on strategic fit but low on confidence and effort.
Classify the response by reversibility and cost. A fix is a low-risk correction, such as updating an inaccurate comparison page. An experiment tests an uncertain response, such as publishing a page for a prompt cluster and checking whether AI answers cite it. A bet commits meaningful resources, such as building a capability to address a repeated buyer objection. Assign an owner, review date, and success measure to each.
The competitive intelligence in marketing should inform a decision, not become a standing research ritual. Track prompt visibility, citation sources, brand perception, and the intended business outcome; treat traffic attribution as directional unless the measurement supports a stronger claim. Teams that turn competitor insights into marketing strategy still need to revisit priorities when evidence changes.
How the eight competitive analysis deck formats differ by purpose, core question, and structure
| Item | Best For | Core Question | Suggested Slide Count |
|---|---|---|---|
| Competitive Positioning Matrix Deck | Clarifying market differentiation | How is the product positioned against alternatives? | 5 slides |
| Weighted Feature and Capability Scorecard Deck | Comparing products against buyer requirements | Which product best meets the target customer's weighted needs? | 5 slides |
| AI Visibility and Share-of-Voice Benchmark Deck | Measuring brand presence in AI answers | How often and how prominently do brands appear in sampled AI answers? | 6 slides |
| Citation Sources and Content Gap Deck | Finding content and distribution opportunities | Which sources support competitors' visibility, and where are the gaps? | 6 slides |
| Competitor Messaging and AI Brand Perception Deck | Assessing positioning accuracy and perception | How do competitors, customers, and AI describe each brand? | 6 slides |
| Win-Loss Analysis and Competitive Battlecard Deck | Understanding real buying decisions | Why do customers choose or reject each alternative? | 6 slides |
| Competitive Pricing, Packaging, and Total Cost Deck | Comparing pricing and value across workloads | What do customers receive and pay for under comparable scenarios? | 6 slides |
| Competitive Strategy and Prioritized Response Deck | Turning competitive evidence into action | Which competitive priorities should the organization act on? | 6 slides |
Choose the Deck That Matches Your Next Decision
Start with the decision on the calendar, not with a template gallery. If leadership cannot explain where you sit against SEO suites, listening tools, and visibility products, build the positioning matrix and stop there. If product is arguing about a roadmap, build the weighted scorecard and test one real task. If the fight is about who shows up in answers, lock a prompt cohort and a written definition of share of voice and mention rate before anyone requests another chart. If sales is losing deals, interview the losses. If finance is comparing plans, normalize a workload. Do not ship all eight decks in one quarter. You will produce slides and no owner.
The order that holds up in front of executives is evidence, implication, action. A competitive analysis deck that only ranks rivals leaves the "so what" in the hallway. Pair each material gap with the prompt it affects, the source or claim involved, the person who will change it, and the metric you will reread. That metric might be position, citation rate, sentiment, or attributed visits. Label what you observed, what you inferred, and what you still do not know. A single share-of-voice number that ignores country, job, prompt type, and provider will get you a confident decision and a wrong one.
Pick one prompt cohort this week. Write the share-of-voice formula and the mention-rate formula on the first slide. Set the collection method, the date, and the sample size. Schedule the first review before you debate strategy. MyMentions is one option for keeping that baseline, comparing competitors on the same prompts, and turning movement into a backlog your team can ship. If the number does not change a content, product, pricing, or sales action, you measured the wrong thing.
MyMentions tracks how AI assistants discover, rank, and describe your product, then compares that visibility, sentiment, and the citation sources behind it with the competitors on your list. Use it to turn a prompt cohort into the evidence a competitive analysis deck needs, from share of voice and average rank to the gaps worth fixing. Visit MyMentions to set the baseline and keep the next review tied to a decision.