AI visibility can influence a buying decision long before it produces a visit. Cloudflare's April 2026 referral snapshot found that all AI chatbots combined generated 0.27% of search referral traffic, while Google accounted for 87.52%. Yet a separate 2026 benchmark cited in the same analysis found that AI contributed 4% of sessions but 19% of qualified inbound pipeline for a B2B cohort. The underlying referral analysis makes the practical point clear: low click volume doesn't mean low influence.
That's why learning how to track AI visibility requires more than counting brand mentions. You need prompt-level monitoring, cross-provider sampling, citation analysis, volatility controls, competitive context, and a path from AI answers to traffic and pipeline.
Table of Contents
- Why AI Visibility Needs Its Own Measurement System
- Building Your Buyer Intent Prompt Library
- Key Metrics That Actually Define AI Visibility
- How to Collect Reliable Data Across AI Providers
- Benchmarking Competitors and Turning Gaps Into Fixes
- Dashboards Alerts and Reports That Prove Impact
Why AI Visibility Needs Its Own Measurement System
Traditional SEO reports answer questions such as, “Where does this page rank?” and “How many impressions or clicks did this query produce?” AI assistants answer a different question for the buyer: “Which products or sources should I consider?” The assistant may mention your company, cite a third-party review, summarize your documentation, or recommend a competitor without creating a measurable visit.
The referral gap reinforces why traffic alone is a weak starting point. Google still dominates referral discovery, while AI answers can shape awareness, evaluation, and shortlisting before a buyer visits any website. If your reporting merges AI activity into organic search, you'll miss the difference between being visible in an answer and being cited as the evidence behind it.
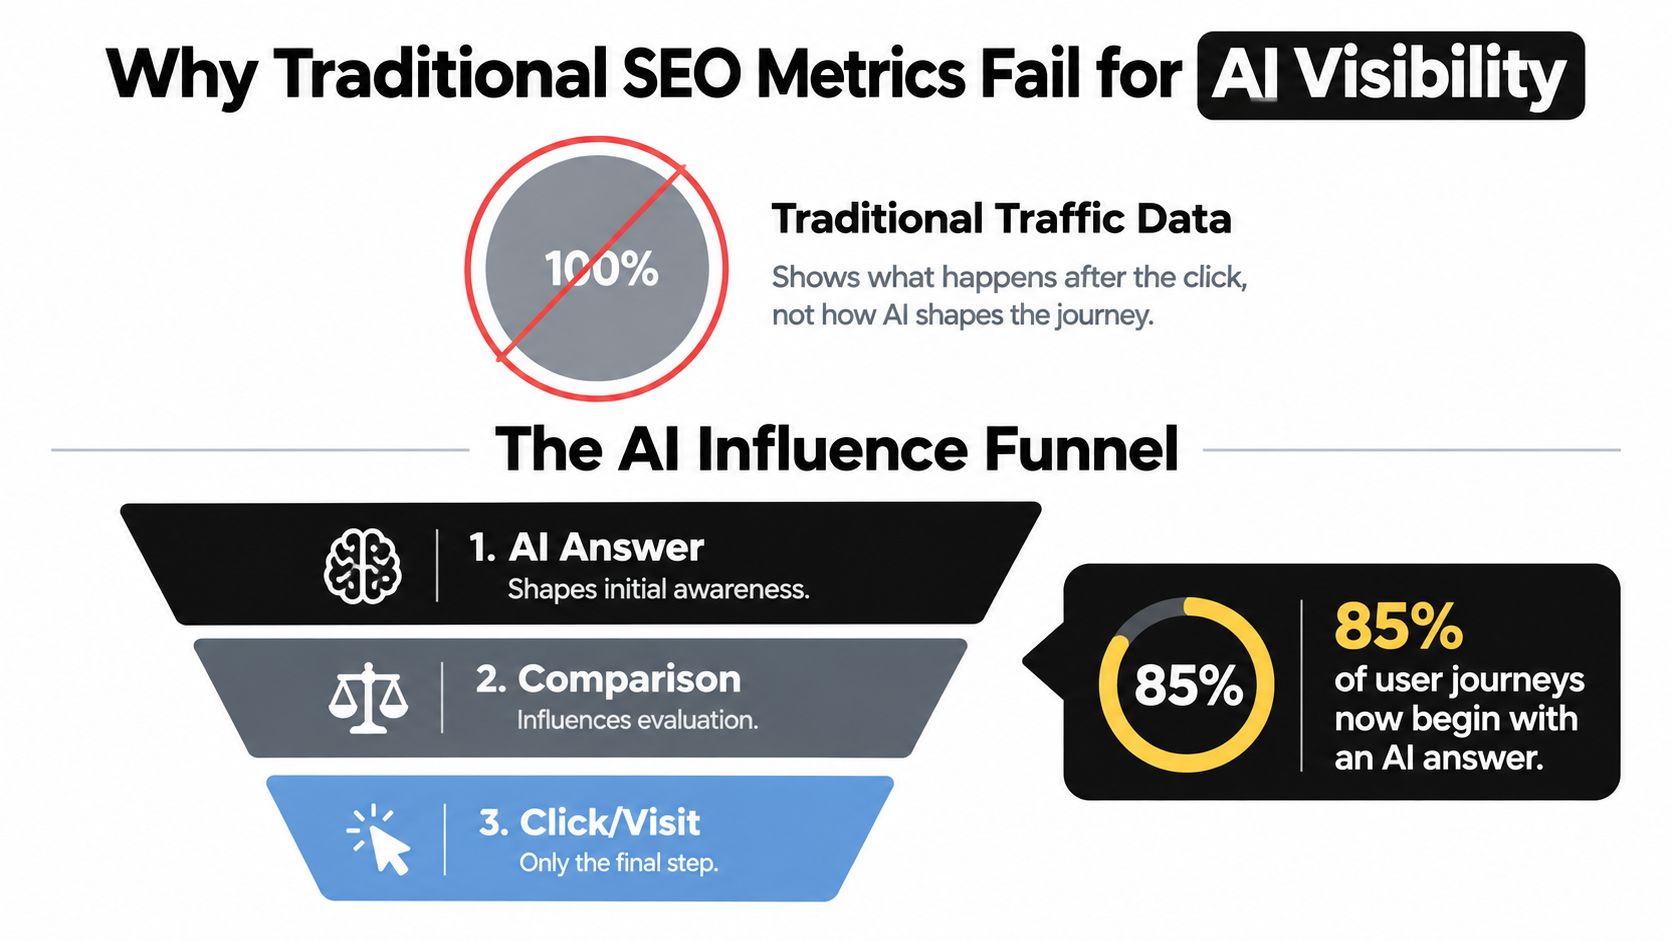
Separate the funnel layers
Treat AI visibility as a distinct layer alongside SEO, not as a replacement for it.
- AI answer: Does the assistant include your brand or product when a buyer asks a relevant question?
- Evaluation context: Does it describe your strengths accurately, present you as a credible option, and include competitors?
- Citation layer: Does it reference your own page, documentation, research, or another source about you?
- Visit and conversion layer: Can you connect answer exposure with referral sessions, assisted conversions, or pipeline?
This model prevents a common reporting error. A mention is a visibility signal, a citation is an attribution signal, and a visit is a behavioral signal. They're related, but they aren't interchangeable.
Track answers at the prompt level
A keyword ranking is usually tied to a search result page. An AI answer depends on the exact wording, provider, model surface, location, login state, device, language, and retrieval conditions. Your system therefore needs a stable prompt library and a record of the context used for every run.
For a useful introduction to the category, how AI affects search visibility provides additional context on why answer engines change the relationship between content discovery and website traffic. You can also review what AI visibility means for marketers before designing your reporting taxonomy.
The operational takeaway is simple: create a separate AI visibility report with mention rate, citation rate, prominence, sentiment, competitive inclusion, source domains, and downstream attribution. Don't wait for AI referrals to become a large traffic channel before you start measuring it.
Building Your Buyer Intent Prompt Library
Your prompt library is the measurement instrument. If it contains vague questions or only branded searches, the resulting dashboard may look precise while describing very little about the buying journey.
Start with the decisions your buyers make, then express those decisions as natural questions. A SaaS company might need to know whether assistants recommend it for a category, explain its product accurately, compare it with rivals, or identify it as a fit for a specific use case.
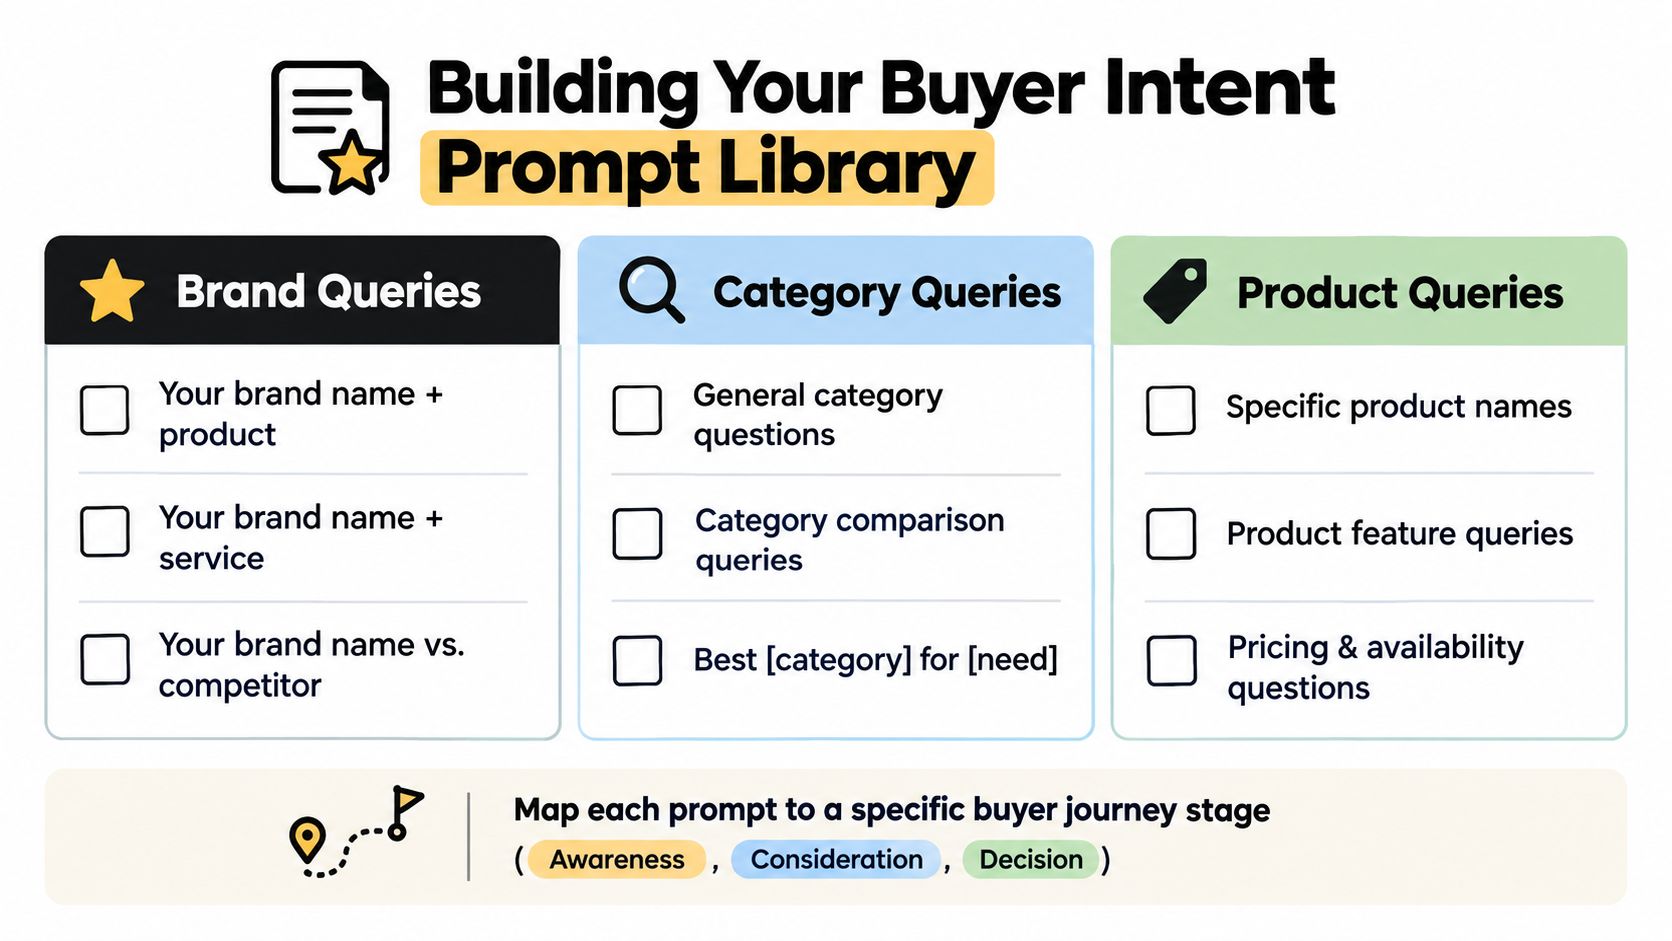
Build three query families
Brand prompts test whether the assistant understands your identity and positioning. Use prompts such as:
- “What does [brand] do for product teams?”
- “Is [brand] suitable for a growing SaaS company?”
- “How does [brand] compare with [competitor]?”
Category prompts test discovery among buyers who may not know you yet. Examples include:
- “What tools help SaaS teams monitor AI search visibility?”
- “Which platforms are useful for tracking brand mentions in AI answers?”
- “What should a marketing team look for in an AI visibility analytics tool?”
Product and job-to-be-done prompts test specific evaluation moments:
- “Which tools track citations across ChatGPT, Gemini, and Perplexity?”
- “How can a company connect AI mentions with website visits?”
- “What should I use to benchmark AI visibility against competitors?”
The wording matters. “Tell me about AI visibility” is too broad to guide a decision. “Which AI visibility tools help a B2B SaaS team monitor citations and competitor inclusion?” maps to a real buying need and produces a more actionable result.
Map prompts to intent
Assign every prompt to a journey stage such as awareness, consideration, or decision. Then add attributes for audience, use case, product category, competitor, and desired outcome.
This segmentation reveals gaps that an overall score hides. You might appear frequently for branded questions but disappear from category discovery. You might be recommended for awareness use cases but omitted from pricing and implementation comparisons. Those are different problems, requiring different content and distribution responses.
The IAB measurement guidance emphasizes that decision-grade measurement needs query volume, prompt-type coverage, testing cadence, reproducibility, and platform coverage. In practice, enterprise tracking guidance commonly uses roughly 50 to 500 prompts for a defined intent space, with the final range determined by category complexity and available resources.
Keep the initial library stable. You can add exploratory prompts, but don't constantly replace the core set, or trend comparisons will lose meaning. For prompt design ideas, see this guide to creating effective AI prompts.
Key Metrics That Actually Define AI Visibility
A useful AI visibility program separates five questions:
- Are we present?
- How prominent are we?
- Are we being cited or merely mentioned?
- How does the assistant describe us?
- Does visibility influence measurable business activity?
A single visibility score can provide a quick pulse, but it shouldn't replace the underlying measures. Each metric describes a different layer of the funnel.
| Metric | What It Measures | When It Matters Most |
|---|---|---|
| Share of voice | Your presence relative to competitors across tracked prompts | Category discovery and competitive planning |
| Prominence | Where and how strongly your brand appears in an answer | Recommendation and comparison queries |
| Citation rate | How often your pages or domains are used as sources | Authority, attribution, and content evaluation |
| Mention rate | How often the assistant names your brand or product | Awareness and brand recall |
| Sentiment and context | Whether the description is favorable, neutral, inaccurate, or negative | Positioning, reputation, and product marketing |
| Referral and conversion data | Visits and outcomes associated with AI-referred activity | Business impact and budget decisions |
Don't merge mentions with citations
A brand can be mentioned without receiving a source link. It can also be cited without being presented as the primary recommendation. Record both events and add citation quality fields such as source URL, source domain, link presence, context, and prominence.
A practical dashboard should distinguish between:
- Direct brand mention: the answer names your company or product.
- Product recommendation: the answer places your product among suggested options.
- Owned citation: the assistant links to your page or documentation.
- Third-party citation: the assistant relies on a review, partner page, publication, or directory.
- Competitive inclusion: competitors appear in the same answer.
- Description quality: the assistant explains your product accurately and in the intended positioning.
Connect visibility with outcomes carefully
Referral data is useful, but AI assistants may influence a buyer without sending a click. Use tagged landing pages, referral-source reporting, CRM capture, self-reported attribution, and assisted-conversion analysis where available. Don't treat sparse AI referral traffic as the complete value of the channel.
The stronger approach combines AI impression or answer exposure data, citation data, and referral or conversion data. Each measures a different layer, so the relationship between them matters more than any isolated number. A rise in citations with no visits may still indicate stronger authority or evaluation-stage influence. A rise in visits without citations may reflect a narrow set of answer links or a provider-specific change.
How to Collect Reliable Data Across AI Providers
The collection process must be repeatable before the dashboard can support decisions. AI answers fluctuate, so a single manual check is evidence of what happened once, not a reliable baseline.
Begin with a fixed prompt set and distribute each prompt across the providers relevant to your audience. Depending on your market, that may include OpenAI, Google Gemini, Anthropic Claude, Microsoft Copilot, Perplexity, Grok, or DeepSeek. Keep the prompt text identical where the interface allows it, and record the provider and surface used.
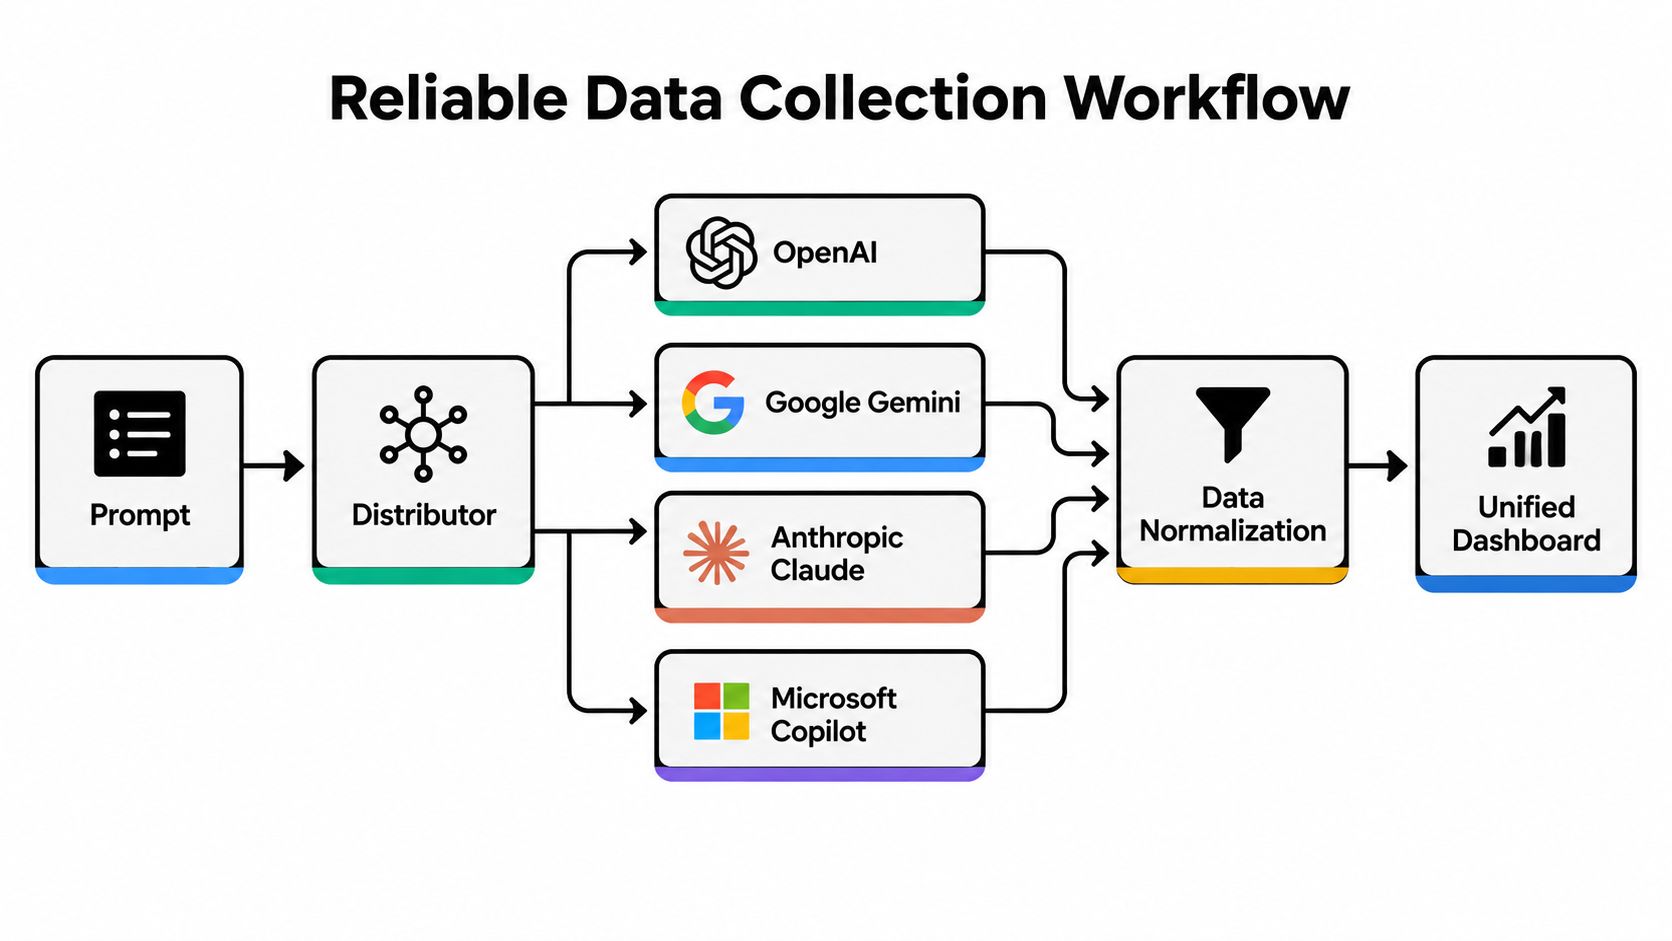
Use repeated runs instead of screenshots
Measurement playbooks recommend a stable baseline of 50 to 100 decision-intent prompts, running each prompt 5 to 10 times per model, then reporting a 7-day rolling average and a volatility index. The measurement playbook behind this sampling approach explains why repeated observations are more useful than one-off results.
For each run, store the raw answer as well as normalized fields:
- Prompt ID: A permanent identifier tied to the exact wording.
- Provider and surface: The assistant, model experience, and retrieval mode.
- Context fields: Country, language, device, login state, and test date.
- Presence fields: Mention, recommendation, citation, and competitor inclusion.
- Quality fields: Prominence, sentiment, accuracy, citation position, and source type.
- Attribution fields: Referral sessions, landing page, assisted conversion, and pipeline association where available.
Country, device, language, and login state aren't decorative metadata. They can change the answer layout, cited sources, and brand inclusion. If you don't store them, you may interpret a context shift as a content or visibility change.
Normalize before comparing
Different providers format answers differently. One may include linked citations, another may provide a source list, and another may mention a domain without a clickable reference. Define your extraction rules before collecting data. For example, decide what counts as a citation, how you'll score prominence, and how you'll classify a source as owned, earned, partner, review, or documentation.
A data collection overview such as Fetchin's explanation of web data collection is useful background when you're designing the capture layer. For provider-specific differences, maintain a reference such as this AI provider comparison, but keep the measurement schema consistent across platforms.
Review trends, not isolated changes
Use weekly or biweekly monitoring for directional movement and compare rolling averages rather than screenshots. Add a volatility index so stakeholders can see whether a change is stable or the result of answer variation.
Human review remains necessary. Enterprise guidance recommends weekly citation-share snapshots per engine or category and a monthly human review of 20 to 30 citations to audit attribution quality and correlate changes with content updates. Automation finds patterns, but people still need to confirm whether the assistant cited the right page and described the product correctly.
Benchmarking Competitors and Turning Gaps Into Fixes
Competitive benchmarking changes the question from “Did we get mentioned?” to “Who gets included when buyers ask this question?” Track your brand and a defined competitor set against the same prompts, then compare share of voice, citation share, prominence, sentiment, and source footprint.

The source footprint often explains more than the headline score. If competitors appear because assistants rely on detailed review pages, partner comparisons, or current product documentation, creating another generic blog post probably won't close the gap. If your own documentation is cited but your category pages aren't, the problem may be discoverability or positioning rather than product authority.
Find the source-domain pattern
Export cited domains and group them by role:
- Owned sources: Product pages, help centers, documentation, research, and company articles.
- Earned sources: Industry publications, independent reviews, analyst pages, and communities.
- Partner sources: Integrations, resellers, agencies, and ecosystem pages.
- Stale or inaccurate sources: Pages that describe an old product, obsolete pricing, or discontinued features.
This analysis produces a concrete backlog. An inaccurate third-party page may call for outreach or clarification. A missing feature explanation may require documentation. A comparison gap may require a neutral, evidence-led page that explains the difference without relying on unsupported superiority claims.
Semrush's expanded 2026 AI Visibility Index analyzed 126 million AI search prompts, demonstrating that large-sample, cross-provider measurement is now practical at industry scale. Semrush's announcement is a useful benchmark for understanding why competitor comparisons should use enough prompt and provider coverage to avoid overreacting to a small sample.
A short visual explanation can help stakeholders understand the competitive layer before they review the backlog:
Prioritize the fix, not the fluctuation
Rank opportunities by commercial intent, visibility gap, source quality, and implementation effort. A high-intent prompt where a competitor dominates and your product is absent should generally outrank a low-intent prompt with a minor prominence decline.
Use four backlog categories:
- Trust: Earn credible third-party references and correct inaccurate descriptions.
- Content: Fill missing topic, feature, comparison, and use-case coverage.
- Experience: Make important product facts easy to find and quote.
- Technical: Improve crawlability, internal linking, structured information, and page clarity.
For competitive research workflows, this guide to competitive intelligence in marketing offers useful framing. The key is to assign each gap an owner, a proposed change, and a measurement window. Otherwise, the dashboard becomes an observation tool instead of a growth system.
Dashboards Alerts and Reports That Prove Impact
A decision-ready dashboard should let a founder answer one question quickly: “Are buyers encountering us in AI answers, and is that exposure contributing to growth?” The dashboard should then let the marketing and SEO teams diagnose the answer without opening dozens of provider interfaces.
Use a layered view:
- Executive layer: Share of voice, mention rate, citation rate, sentiment, and traffic or pipeline attribution.
- Provider layer: Performance by assistant, model surface, country, device, and language.
- Prompt layer: Exact answers, cited URLs, prominence, competitors, and trend history.
- Action layer: Open content, trust, UX, and technical recommendations tied to each gap.
Reports should separate visibility movement from business movement. A citation-share change belongs beside the prompt and source evidence that caused it. Referral sessions and conversions belong beside their attribution method, not as an implied result of every mention.
Build a cadence people will follow
Use weekly monitoring for important prompt clusters, with rolling averages and volatility context. Conduct monthly human reviews of sampled citations, then compare changes against content releases, product updates, PR activity, and technical changes.
Alerts should identify meaningful events rather than every answer variation:
- A sustained decline in category share of voice.
- A competitor entering a high-priority prompt cluster.
- A citation shifting from an owned page to a stale third-party source.
- A negative or inaccurate product description.
- A significant change in referral or conversion behavior associated with AI traffic.
Send alerts through the channels your team already uses, such as Slack, Discord, or email. A dashboard that requires manual checking will eventually go stale. For reporting design principles, Querio's overview of dashboards and metrics provides useful context on connecting operational data with stakeholder decisions. Teams that need flexible stakeholder views can also use customizable SEO dashboards as a reporting reference.
MyMentions tracks prompt-level visibility, position, sentiment, citations, competitors, provider results, and traffic attribution in one workspace. It can also surface the source domains shaping AI answers and send visibility alerts through Slack, Discord, or email, which gives teams a direct path from detection to investigation.
MyMentions helps founders, marketers, and SEO teams monitor how AI assistants discover, describe, and recommend their products across buyer-intent prompts. Visit MyMentions to compare providers, identify citation and competitive gaps, and connect AI visibility changes with traffic and pipeline signals.