
A 2025 survey of 2,237 consumers across the United States, United Kingdom, France, and Germany found that 43% used AI search daily or more, while 62% trusted AI to guide brand decisions, according to the Yext report on AI search and consumer trust. A competitor analysis report that stops at websites, price tables, and feature grids misses the channel where those buyers now form a shortlist.
Treat assistant answers as distribution, not a side note to SEO. Every rate in the file needs a business impact, a confidence level, and a named owner. Without those three fields, a review meeting turns into a debate about screenshots.
Table of Contents
- Required Sections of a Competitor Analysis Report
- Scoping the Competitor Set and Comparing Features and Prices
- Mapping Direct Rivals, Substitutes and Market Forces
- Sampling Protocol and Data Quality Controls
- Metrics to Track in Every Competitor Report
- Comparing Visibility Across AI Assistants
- Linking Visibility to Business Impact
- Example Finding and Exportable Report Templates
- Choose Your First Three Competitor Gaps to Close
Required Sections of a Competitor Analysis Report
Copy this order. A reader should be able to audit the file in about two minutes, because each block ends in a finding and a decision, not a dump of screenshots.
- Executive summary. Three findings and one decision. The metric is a count of headline findings, written by the analyst, not exported from a tool.
- Scope and competitor set. Direct rivals, substitutes, and the collection dates. The metric is competitor count by tier, pulled from the CRM and the last report.
- Market context. How hard the industry structure pushes on margin. The metric is a five-forces score from 1 to 5, backed by market reports and analyst notes.
- Feature and pricing comparison. Where you match, lead, or trail. Report feature parity percentage and list price from pricing pages and product docs.
- AI and search visibility. Who is mentioned, ranked, or recommended. Report visibility rate and share of voice from a fixed prompt panel.
- Citation source audit. Which domains shape the answers. Report citation share by domain from logged responses.
- Sentiment and accuracy log. Where rivals are described favorably, harshly, or wrongly. Report positive rate and a misrepresentation count from a text review.
- Prioritized recommendations. What happens first, and who owns it. Score impact, confidence, and effort from the findings above.
| Section | Question it answers | Core metric | Typical source |
|---|---|---|---|
| Executive summary | Which three findings and one decision matter most? | Headline findings count | Analyst synthesis |
| Scope and competitor set | Who are the direct rivals, substitutes and the date range? | Competitor count and tiers | Brief, CRM, prior reports |
| Market context | How strong are the industry forces? | Five-forces score from 1 to 5 | Market reports, analyst notes |
| Feature and pricing comparison | Where do we match, lead or trail? | Feature parity percentage, list price | Pricing pages, product docs |
| AI and search visibility | Who gets mentioned, ranked or recommended? | Visibility rate, share of voice | Prompt panel results |
| Citation source audit | Which sources shape competitor answers? | Citation share by domain | Logged AI responses |
| Sentiment and accuracy log | Where are competitors described negatively or wrongly? | Positive rate, misrepresentation count | Response text review |
| Prioritized recommendations | What do we do first, and who owns it? | Impact, confidence, effort | Scoring of findings |
What a small team can shorten
Market context and the feature comparison can each sit on one page. Visibility and the recommendation backlog stay full length, because those are the pages a founder will argue from. Scope can't be shortened into a logo wall. If the dates and the tiers are missing, every later percentage is unreadable.
A complete section ends in a decision a colleague can accept or reject. Raw rows are evidence, not the finding.
A California Management Review account states that the competitive-intelligence revolution began in the 1980s, and that by the end of the 20th century almost all global Fortune 500 companies reportedly had competitive-intelligence professionals in headquarters or inside business units. The same account notes that many firms first sent that information to sales and marketing managers, where analysts were often treated as archivists rather than advisers. Your competitor analysis report fails the same way if it stores rival claims and never names a segment, a gap, or a move to watch.
Scoping the Competitor Set and Comparing Features and Prices
Lock the brief before anyone scores a rival. Name the decision the report supports, the market and geography, and the collection window, such as 1 to 31 March. A price captured outside that window isn't a change. It's a different study.
Sort names into three tiers and count each tier.
- Direct rivals: They sell the same job to the same buyer, and they show up in live deals.
- Substitutes: An internal spreadsheet, an SEO suite, or an agency can win the budget even when feature overlap is thin.
- Watch-list players: Adjacent products that aren't in deals yet, logged so a surprise launch isn't the first time you see them.
Eight direct rivals and two substitutes is a crowded category. Two direct rivals and eight substitutes is a workflow fight. Those reports should not share a headline.
Feature parity and list price
List about 20 capabilities buyers use to shortlist vendors. Mark each one present, partial, or absent. Feature parity percentage is matched capabilities divided by compared capabilities, times 100. A partial never counts as a full match. Flag it with the evidence, a documentation URL or trial notes, so a reviewer can see the limit.
Capture list price from the pricing page on the collection date, with plan name, billing period, and currency. That is how a later reader separates a real price move from a renamed plan. Visbanking's guide to competitor analysis is a useful model of fixing the comparison set before you interpret gaps, and the same habit applies when you track competitor pricing across plan definitions.
| Field | Definition | Calculation | Typical source |
|---|---|---|---|
| Competitor count and tiers | Direct rivals, substitutes and watch-list players in scope | Count per tier | Brief, CRM, prior reports |
| Feature parity percentage | Share of compared capabilities the competitor also offers | Matched capabilities divided by compared capabilities, times 100 | Product docs, trial access |
| List price | Published entry price for the named plan | Price as shown on the collection date, with currency and billing period | Pricing pages |
| Partial capability | Feature present with a stated limit | Flagged and evidenced, never counted as a full match | Documentation, trial notes |
Close the sheet with one line: the rival you most need to beat, and the buyer job where they win. The table is there to support that sentence.
Mapping Direct Rivals, Substitutes and Market Forces
Porter's five-forces framework gave competitive analysis a widely used structure when he published “How Competitive Forces Shape Strategy” in Harvard Business Review in 1979. The framework's five forces are rivalry among existing firms, the threat of new entrants, supplier bargaining power, buyer bargaining power, and the threat of substitutes.
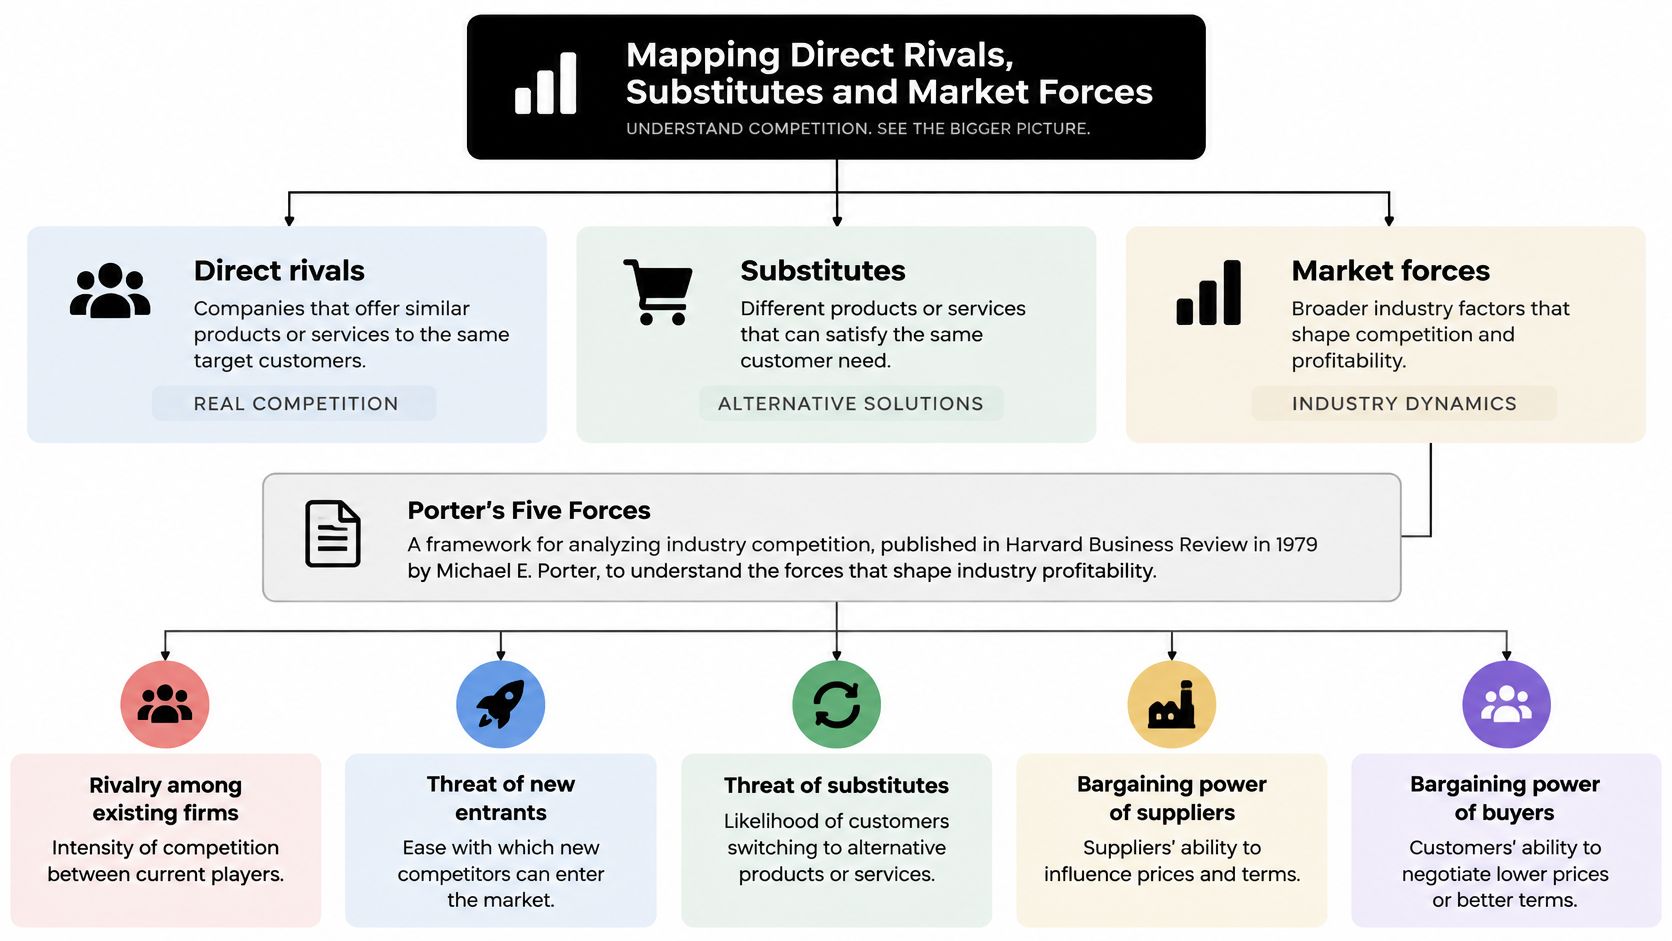
Turn each force into a scored field
Score each force from 1 to 5, then record the evidence, date, market scope, and confidence beside the score. A number without those details is hard to assess or compare.
- Rivalry: Record competitor count, concentration, and feature or pricing similarity. High similarity and low switching costs point to potential price pressure.
- New entrants: Identify specific entry barriers, such as data history, integrations, or a regulated buying process.
- Substitutes: Include alternatives such as a specialized tool, spreadsheet, SEO suite, or agency. Limited feature overlap does not rule out a substitute in a deal.
- Suppliers: Record platform or data dependencies and the friction involved in changing suppliers.
- Buyers: Assess how easily customers can leave and how many alternatives they can name without help.
Build a force-by-segment matrix for founders, marketing teams, SEO teams, and enterprise competitive-intelligence users. The same product may face different buyer power across segments: founders may have fewer established processes to compare, while enterprise teams may already use an internal process. If public-sector bids are in scope, compare how buyers assess a GovWin alternative against an agency or a homegrown tracker. That buyer-specific comparison reflects competitive intelligence versus market research: it connects market conditions to a defined competitor and decision.
Use the matrix to identify where differentiation is defensible, where price pressure may emerge, and which competitor moves need a named watcher before the next collection window. Give each finding a business impact, confidence level, and owner so the report can guide action, not just describe the market.
Sampling Protocol and Data Quality Controls
Rates that can't be rerun aren't metrics. They're opinions with percentages attached. ISO 10668:2010 sets a framework for monetary brand valuation covering objectives, bases, approaches, methods, data quality, assumptions, and how results are reported. You don't need a dollar brand value to borrow the controls. Define the decision, the comparison population, the geography, the assumptions, what is primary versus secondary evidence, and the uncertainty.
Run this checklist before each cycle
- Prompt taxonomy: Fix six types before you measure: category discovery, alternatives, comparison, pricing, use case, and problem-oriented.
- Provider log: Record provider, model version, date, locale, and temperature or any other setting the product exposes.
- Same frame: Run the same prompt set for every brand in the set. Repeat runs to smooth one-off variance.
- Uncertainty: Put sample size and a confidence interval beside each rate. Record evaluator agreement on sentiment labels.
- Normalization note: If the prompt set or the collection period changes, write the note before anyone compares the new scores with the old ones.
Scores from different prompt sets aren't a trend. RentReboot's approach to tracking available apartments shows the same idea in another market: fix the definition, then count. Your prompt log should be that strict.
Practical rule: Every recommendation links to an observed gap, the quality of the evidence, the expected impact, and an owner. A gap with no owner is a note, not a decision.
Calculate share of mentions, mean or median position, citation-source overlap, and positive, neutral, and negative rates from that single frame. Primary evidence is the logged response. A rival's homepage claim is secondary until an answer uses it.
Metrics to Track in Every Competitor Report
Define the metric before you trust the dashboard. Seven fields cover a competitor analysis report that a reviewer can recompute. AI rates are comparable only inside one prompt set and one period.
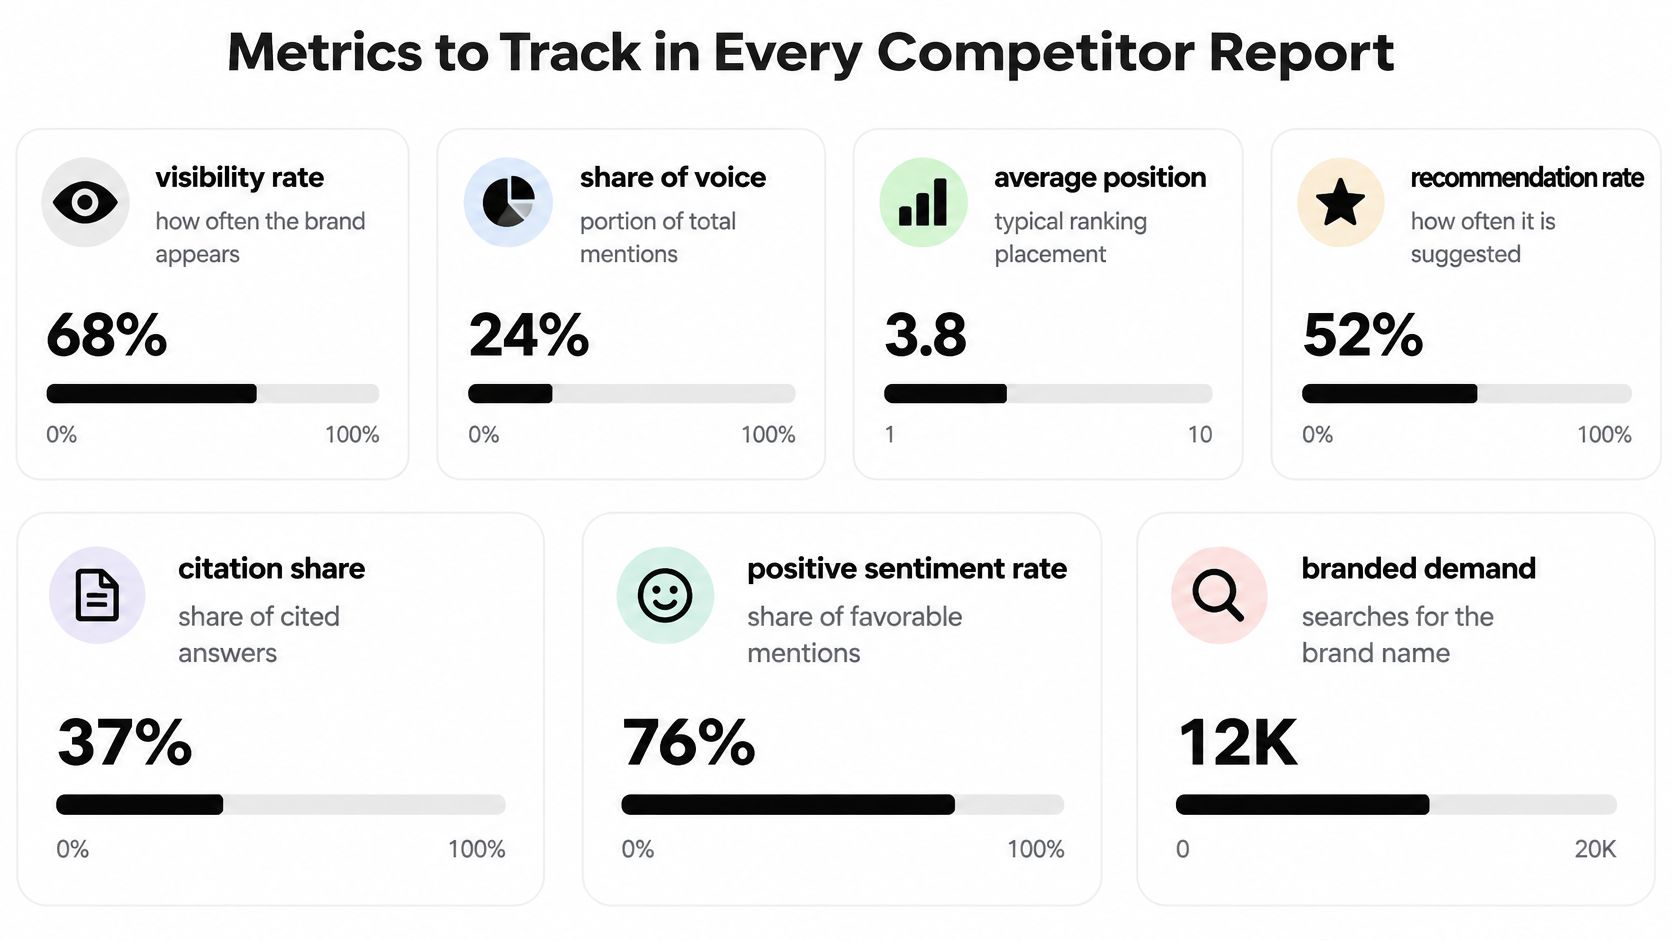
| Metric | Definition | Calculation | Reading guidance |
|---|---|---|---|
| Visibility rate | Share of tracked prompts where the brand appears | Prompts with a brand mention divided by total prompts, times 100 | Compare only within the same prompt set |
| Share of voice | The brand's portion of all brand mentions in the set | Brand mentions divided by all brand mentions, times 100 | Shows relative weight, not absolute reach |
| Average position | Typical rank when the brand is listed | Mean rank across answers where the brand is listed | Lower is better; report the sample size beside it |
| Recommendation rate | Share of mentions framed as a top pick | Recommended mentions divided by all mentions, times 100 | Separates being listed from being chosen |
| Citation share | Portion of cited sources from each domain | Citations from a domain divided by all citations, times 100 | Points to the pages worth matching or improving |
| Positive sentiment rate | Share of mentions labelled positive | Positive-labelled mentions divided by all mentions, times 100 | Requires a stated labelling rule and evaluator agreement |
| Estimated traffic share | Competitor share of category visits | Competitor visits divided by category visits, from analytics or third-party estimates | Label figures clearly as estimates |
Recommendation rate sits beside visibility on purpose. A brand can show up in half the answers and still be the pick in almost none of them. Citation share tells you which pages to match. Positive sentiment rate is only as good as the labelling rule and the agreement between evaluators. Estimated traffic share is always labelled as an estimate.
A five-prompt illustration
Say you run five comparison prompts and log three brands, North, West, and East. North appears in 4 prompts, West in 2, East in 3. That is 9 brand mentions.
North's visibility rate is 4 divided by 5, times 100, so 80%. North's share of voice is 4 divided by 9, times 100, so 44%. West is at 40% visibility and about 22% share of voice. East is at 60% visibility and about 33% share of voice. If North is framed as the top pick in only 1 of its 4 mentions, its recommendation rate is 25%. High visibility, weak recommendation. That is a different problem from being absent.
Put visibility rate, share of voice, and recommendation rate in the executive summary. Leave citation share and the sentiment detail in the appendix for the people who will do competitor benchmarking against the same prompt file. Executives don't need every domain row to approve the decision.
Comparing Visibility Across AI Assistants
Search rank doesn't set the shortlist an assistant reads aloud. A buyer can ask ChatGPT, Gemini, Perplexity, Claude, Copilot, Grok, or DeepSeek and get a different cast of vendors. Traditional reports compare rankings, pricing, features, traffic, and share of voice. They still don't answer which rivals are mentioned, ranked, cited, or described wrongly when the question is asked inside an assistant.
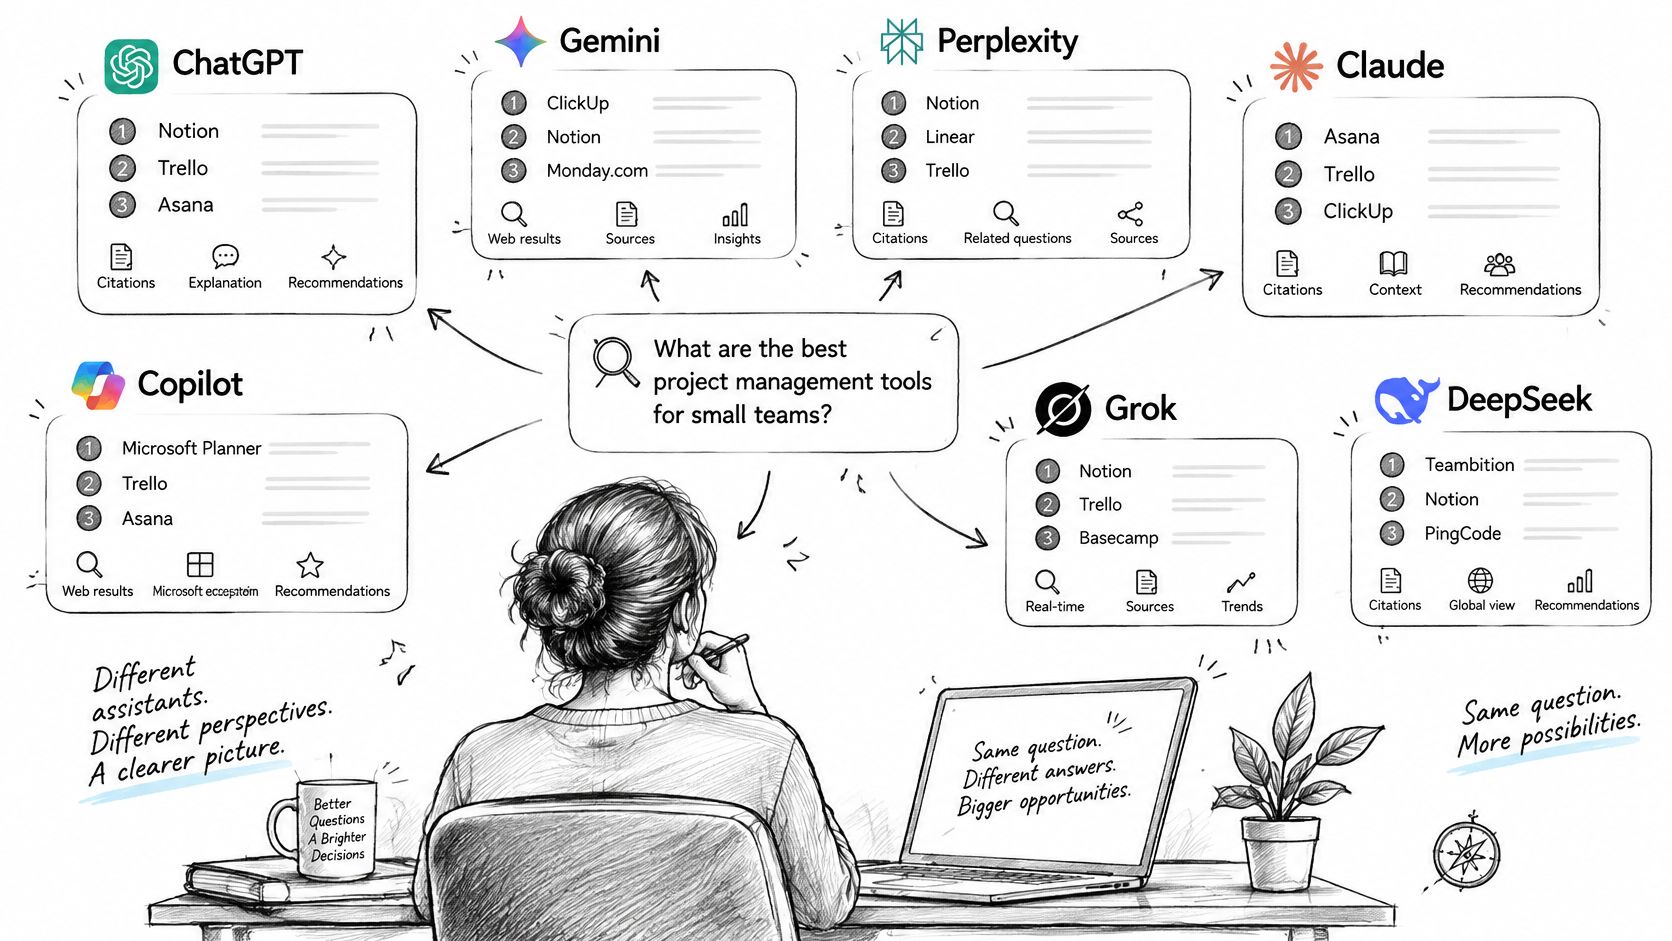
What to log on every response
For each answer, record whether the competitor was mentioned, the position, whether it was recommended or only listed, which sources were cited, and the wording used to describe it. Separate presence from recommendation, sentiment, citation quality, and any downstream action you can observe.
Assistants disagree for ordinary technical reasons. Training data, retrieval systems, geographic context, and source preferences aren't the same product. Say a rival is first in Perplexity on a comparison prompt and missing in Gemini. Don't average those into one "AI rank." Open the citations and see which pages each assistant used. A lead that rests on one review site and one model is a temporary artifact. A lead that repeats across providers, with overlapping citations, looks more like durable authority.
The actions are specific. Improve the documentation those answers cite, widen review coverage, fix partner pages, and publish comparison content that clearly states limits. A workspace such as MyMentions can run one prompt set across supported providers and log the results side by side, so the comparison starts from the same inputs. Teams that want the ongoing version of that log can follow LLM visibility tracking instead of pasting chats into a slide.
Linking Visibility to Business Impact
An AI answer can affect a purchase before a visitor reaches your site. A study tracking 900 U.S. adults found that exposure to a Google AI summary reduced external-site clicks to 8%, compared with 15% when no summary appeared, and 26% of people ended their session after seeing the summary. The findings, reported in the study of Google AI summary click behavior, show why visits alone cannot measure visibility's business impact.
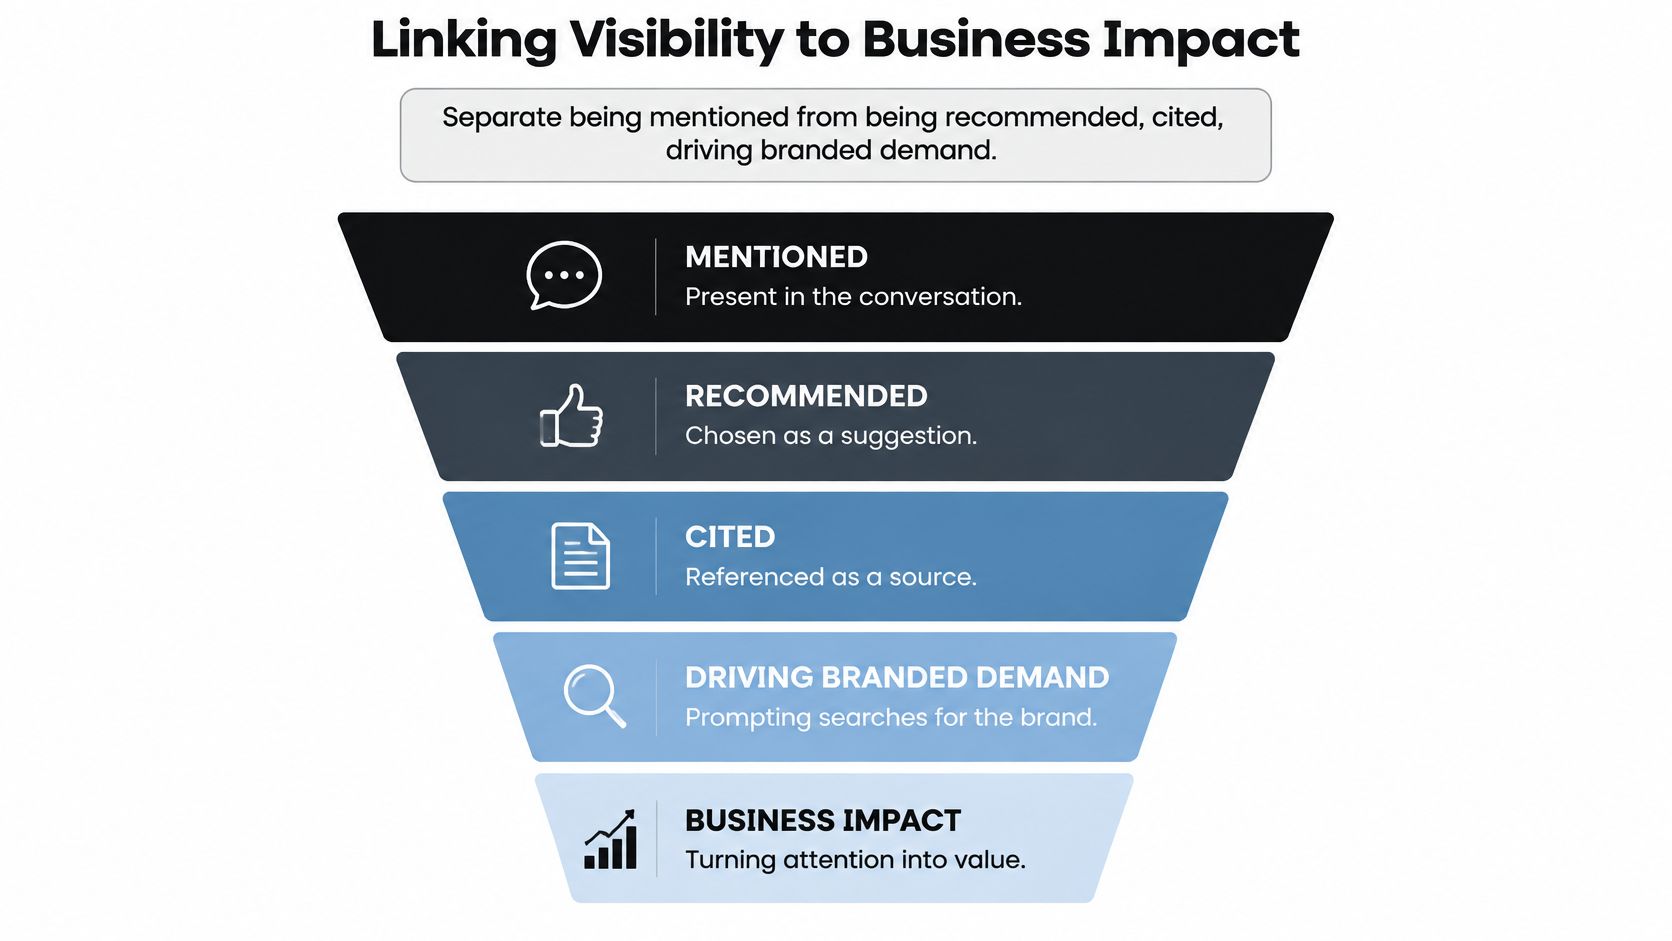
Separate the impact levels
| Impact level | Evidence to collect | Business question | Usual owner |
|---|---|---|---|
| Mentioned | Brand appears in an answer | Are we in the consideration set? | Content or SEO lead |
| Recommended | Brand framed as the top choice | Do buyers pick us over rivals? | Product marketing |
| Cited | Brand page or domain used as a source | Which of our pages do assistants trust? | SEO team |
| Branded demand | Search volume for brand terms after visibility changes | Does visibility create demand? | Growth marketing |
| Assisted conversion | Sign-ups or sales with an AI-influenced first touch, including cases with no site visit | Does AI influence reach revenue? | Analytics team |
| Misrepresented | Answer states a wrong price, feature or claim | What business risk does the error create? | Brand and product teams |
Compare branded search and assisted conversions across periods when visibility changed. Record the confidence level beside each finding and name an owner responsible for acting on it. A single week of movement is weak evidence of revenue impact; a longer comparison can show whether the change coincides with demand or conversions. Pair the prompt log with AI traffic analytics to connect observable visits with assistant visibility.
A wrong price in an assistant's answer can cost a sale without generating a site session. The report should therefore turn each finding into a backlog item tied to a funnel stage, business risk, confidence level, and owner.
Example Finding and Exportable Report Templates
Say you review ten comparison prompts on Perplexity, one run, collected on a single date in one locale. A rival is cited in six. Your brand appears in two. The rival's citations come from its own comparison page and one review site.
The finding, in the order a reviewer should see it, reads like this. Observed gap: the rival is cited in 6 of 10 comparison prompts, and we appear in 2. Evidence quality: ten prompts, one run, medium confidence, because a second run could move a mention or two. Expected impact: comparison-stage visibility, which is where buyers ask for alternatives, not a claim about closed revenue. Owner: the content lead, who will match the comparison page and the review-site gap. That is a finding. "They show up more than we do" isn't.
Files you copy, not rebuild
- Spreadsheet, four tabs: Raw prompt log, metric sheet, citation sources, and recommendation backlog.
- Eight slides: One slide per required section, in the same reading order, with the decision on the last slide.
- One-page PDF: Three findings and one decision for stakeholders who won't open the log.
Raw-log columns, in this order: date, locale, provider, model version, prompt type, mentioned, position, recommended, sources, sentiment, evaluator. Copy the file for the next cycle. Rebuilding headings each month is how definitions drift and how a fair comparison dies.
Choose Your First Three Competitor Gaps to Close
You already have candidate gaps, each with an observation, evidence quality, expected impact, and an owner. Rank them instead of adding new research.
Score every candidate from 1 to 5 on impact, confidence, effort, and risk of inaction. Sort by impact, then by confidence. Use lower effort as the tiebreaker. Move a gap up when it is a misrepresentation. A wrong price or a wrong feature in an assistant's answer costs sales before anyone schedules a review.
Take the top three only.
- Write the owner's name.
- Set a due date inside the next 30 days.
- Name the single metric that will show change, such as visibility rate on comparison prompts, or recommendation rate for one named assistant.
Set the re-run about 30 days out. Use the same prompt set, the same provider versions, and the same locale. If you must change a prompt, write the normalization note before you compare. The test is simple. Could a colleague read the three gaps, the owners, and the re-run date, and start work on Monday without another meeting? If the answer is no, the competitor analysis report isn't finished.
MyMentions logs how AI assistants mention, rank, and describe your product against competitors, using one prompt set across supported providers. It ties visibility, citations, and sentiment to a backlog your team can assign, which is the decision layer this competitor analysis report is built to produce. Visit MyMentions and run that first side-by-side comparison before the next collection window.