Competitive Analysis Chart Template: A Reusable Guide
A reusable competitive analysis chart template with the criteria to compare, scoring rules, and a worked example for filling it in during 2026.
Competitors appeared in nearly 7 in 10 sales opportunities in 2025, according to Crayon's State of Competitive Intelligence report. Very few of those deals turn on a feature the comparison grid bothered to track.
Most competitive analysis chart templates are built for a buyer who reads your table. That buyer is mostly gone. Buyers now ask an assistant, get three names back, and never open the grid. The competitive-intelligence services market was valued at USD 8.72 billion in 2025 by Mordor Intelligence, and a large share of what that budget produces still compares feature counts and seat prices while the two things that decide the shortlist sit in a footnote.
This template moves them into columns. AI answer visibility becomes a tracked row with its own rules, and evidence quality becomes a flag on every cell instead of an assumption. Ten rows, fixed scoring anchors, five flags, one rule per cell.
Table of Contents
- Copy-Ready Competitive Analysis Chart Template
- Choosing Comparison Criteria by Category
- Tracking Competitor Visibility in AI Answers
- Recording Evidence Quality and Confidence
- Filling the Chart With Evidence and Avoiding Errors
- Scoring Scales and Weighting Rules
- Reading a Filled-In Chart at a Glance
- Build Your First Chart This Week
Copy-Ready Competitive Analysis Chart Template
Copy this grid into a spreadsheet before reading further. Ten rows, one per criterion, and as many competitor columns as the decision needs. The same ten rows work for a direct rival, an indirect rival and a substitute, so widening the comparison set means adding a column rather than rebuilding the worksheet.
| Criterion | Category | What to Record | Example Entry (Competitor A) |
|---|---|---|---|
| Target segment | Market | Industry, company size and buyer role served | Mid-market B2B software, 50 to 500 seats, sales operations leads |
| Core capabilities | Product | Top three features and native integrations | Native CRM sync, no public API |
| Pricing model | Commercial | Plan names, price points and billing unit | Per-seat tiers from $49 to $199 per month |
| Distribution | Go-to-market | Sales channels, partners and marketplace listings | Direct sales plus one app marketplace listing |
| Relative cost position | Cost | Estimated cost to serve compared with yours, with the basis for the estimate | Likely lower, based on hiring signals and support tiers |
| Customer sentiment | Voice of customer | Review score, review volume and recurring complaint themes | 4.2 average across 240 reviews, onboarding time is the recurring complaint |
| AI answer visibility | Search | Mention rate, average position and sentiment across tracked prompts | Mentioned in 3 of 10 prompts, average position 2 |
| Cited sources | Search | Domains AI answers cite when they describe the brand | Documentation site and two review platforms |
| Strategic risk | Threats | Substitutes, new entrants and supplier dependence | Free-tier entrant launched in the last quarter |
| Evidence quality | Meta | Source type, publication date and verification status | Vendor pricing page, verified 2026-10 |
Reading the Layout
One column per competitor, one row per criterion. A row reads left to right for a single market condition, and a column reads top to bottom for one brand's full position. Keep a narrow notes column at the far right for the evidence flag and the date of the check, so the value cell stays clean and the provenance stays visible.
Two of the rows carry weight a feature grid never sees. AI answer visibility and cited sources describe what a buyer encounters before they open a landing page, which is where shortlists are now formed. Everything else confirms or contradicts the impression those two rows create.
If you want more than one format in the workbook, Silva Marketing's competitor analysis templates include positioning maps and scorecards that slot into the same columns without redoing the research.
One rule for every cell: a value, the date it was checked and the source it came from, or a question mark that marks the gap openly. A question mark is a finding. A guessed number is a defect.
Choosing which criteria survive, scoring them against fixed anchors and verifying the evidence behind each cell are three separate skills, and each one decides whether the chart is worth keeping.
Choosing Comparison Criteria by Category
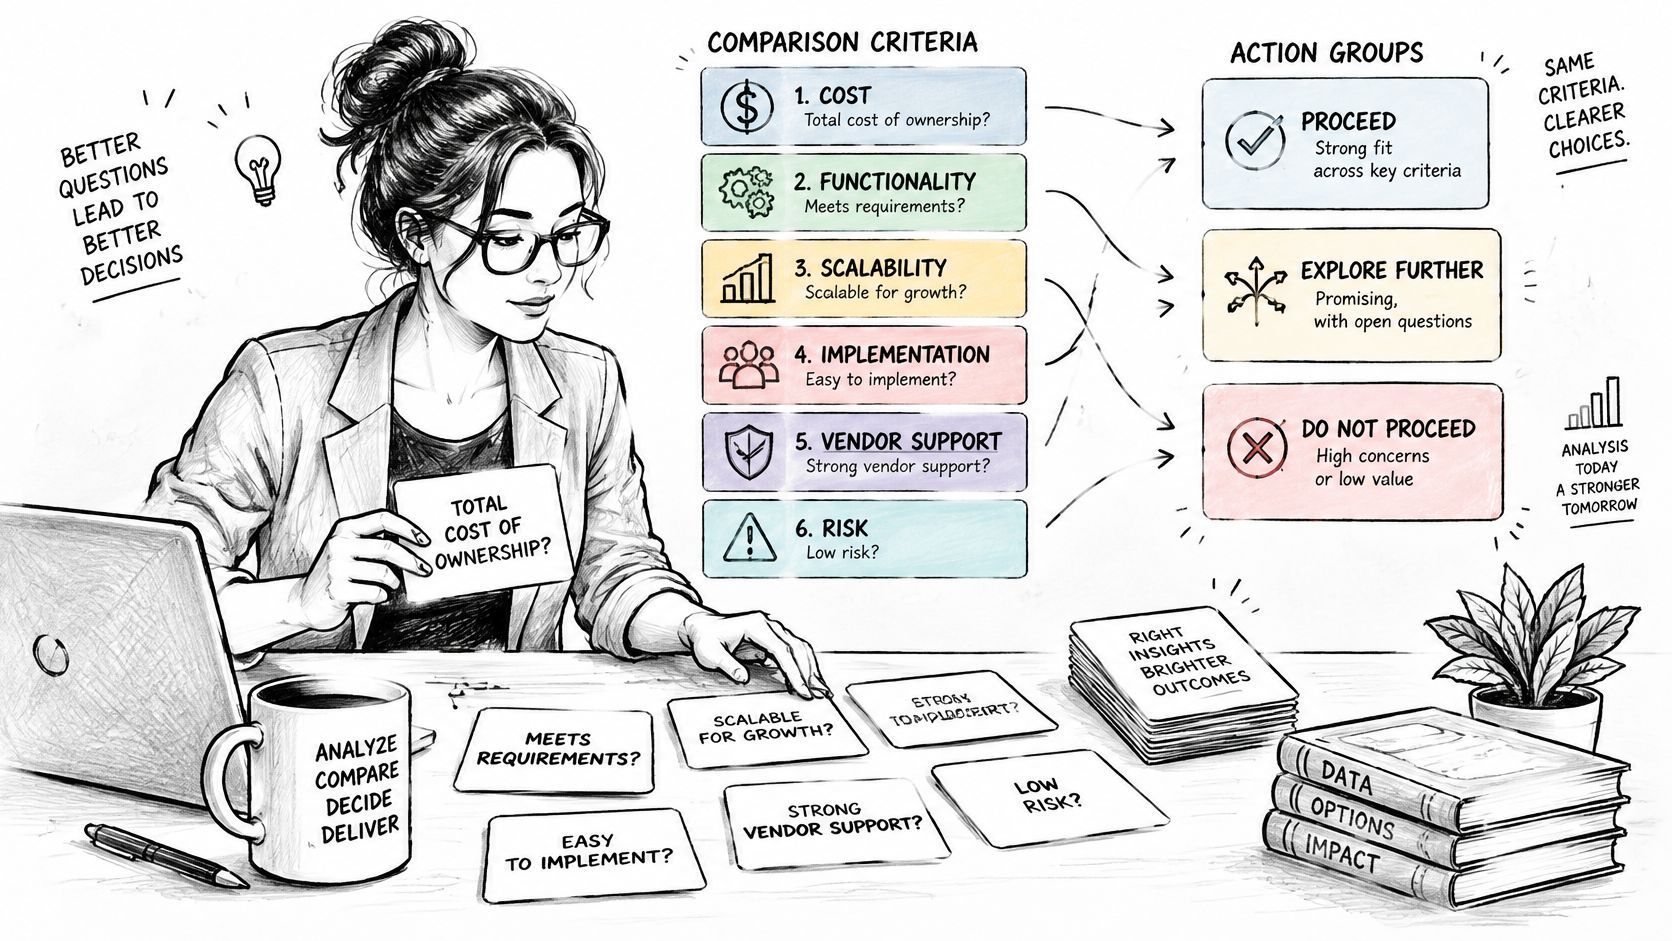
A criterion earns a cell when it changes a business decision. Name the decision and the person who will act before adding a row. That test removes most of what ships inside downloaded templates, because a row that has never altered pricing, roadmap priorities, positioning or a pitch is decoration wearing a label.
Market criteria define who each competitor sells to and expose overlap before product detail matters. Record the target segment, buyer role, company size and primary use case. Two vendors can look identical in a feature grid while serving different buyers, which changes whether they compete for the same budget at all.
Product criteria capture the capabilities that affect selection, plus the three to five integrations buyers ask about. Stop there. A catalogue-length row goes stale quickly and hides the features that settle a deal.
Commercial criteria need normalized pricing rather than a number copied from a pricing page. Record the pricing model, billing unit, contract minimum and included limits. Per-seat and per-account pricing cannot be compared until someone converts them into the same buyer scenario.
Three more categories explain pressure the feature grid misses:
- Go-to-market criteria cover channels, partners, marketplace listings and sales motion. They explain why a smaller competitor keeps appearing in deals you never see.
- Search criteria track how assistants and search engines mention, rank, describe and cite each brand. AI answer visibility earns its own governed row because it reflects demand forming before a prospect reaches your site.
- Threat criteria list substitutes, new entrants and supplier dependence, including the platform whose API terms could change your cost base overnight.
Michael Porter's five sources of competitive pressure, published in Harvard Business Review in 1979 and expanded in Competitive Strategy in 1980, put supplier power, buyer power, new entrants and substitutes alongside rivalry, as Encyclopedia.com's summary of the Five Forces model sets out. For chart design, the useful point is that rival features represent only one pressure. Supplier dependence, buyer influence, entrants and substitutes deserve rows whenever they can change spending or roadmap decisions.
Three final distinctions keep the chart honest. Relative cost position earns a row only when it will change pricing or positioning. Put the basis for the estimate beside the number: hiring signals, support tiers, infrastructure hints or another observable proxy. A marked gap keeps uncertainty visible and protects the chart from false precision.
Customer sentiment earns a row when product or retention decisions depend on buyer language. Use dated third-party review platforms rather than competitor testimonials, and tie the sentiment to the segment being compared. A satisfied small-business base and dissatisfied enterprise customers describe different threats.
Evidence quality is a meta column governing every other row. For search and citation entries, distinguish earned editorial coverage, owned documentation, partner content and paid placements before treating any source as authority. Free AI Directories on link quality provides a useful distinction between an earned editorial mention and a paid placement, which prevents the two from being scored as equivalent evidence.
Once the rows are settled, the competitor benchmarking walkthrough shows how to run the comparison and keep the resulting chart current.
The test every criterion must pass: name the decision it informs and the person who will act on it. If you can't name both, delete the row.
Tracking Competitor Visibility in AI Answers
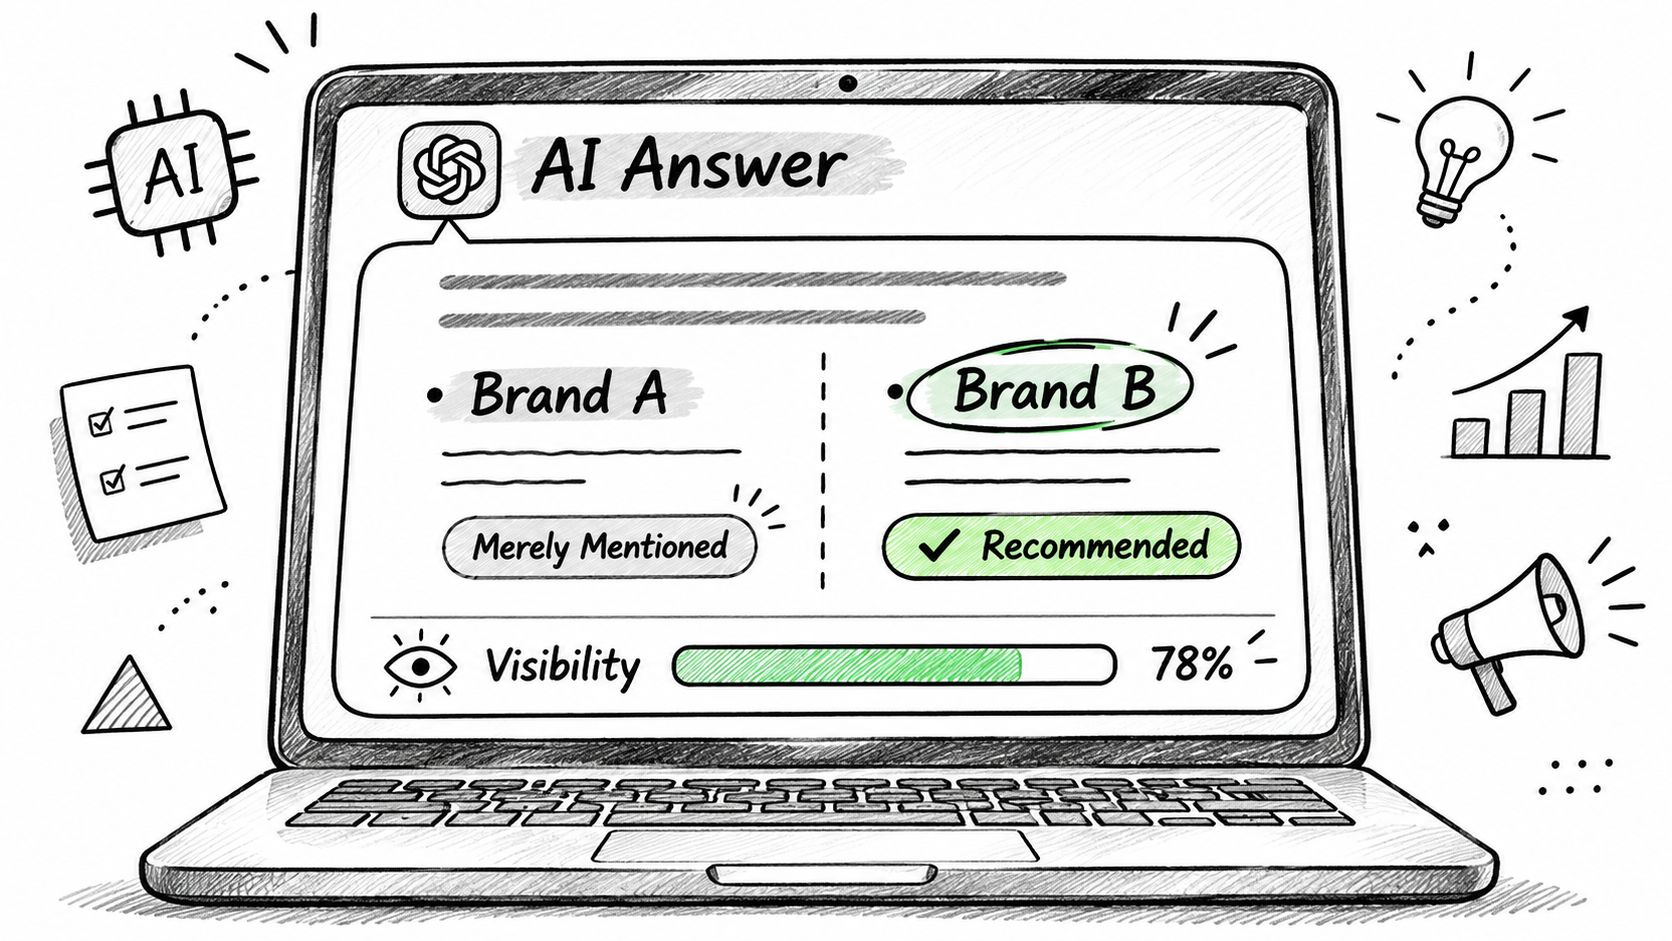
An assistant can name a competitor, describe it badly, decline to recommend it and cite its documentation site in the same answer. A chart that collapses all of that into one visibility number loses the part that predicts revenue.
Visibility, Position and Sentiment Are Three Numbers
Visibility is the share of tracked answers where a brand appears. Position is the average rank when the brand is recommended, so a first-name mention and a footnote mention stop being the same event. Sentiment measures how positive the responses sound around the product, and it belongs beside the exact prompt that produced it, because sentiment on a value question and sentiment on a security question can point in opposite directions.
Being mentioned and being cited are also different competitive positions. The overlap between the 100 most-mentioned brands and the 100 most-cited domains across major AI platforms ranged from only 36.7% to 45.3% in the UK, according to MIT Sloan Management Review's analysis of brand visibility in AI search. A competitor with a loud mention rate and no citation footprint is winning the description and losing the sourcing.
A Worked Check on Ten Prompts
Say a team tracks ten buyer-intent prompts across two assistants, which produces twenty answers per check. Competitor A appears in 6 of the 20 answers, is recommended in 3, is described accurately in 2, and its documentation site is the cited source in 4. Now the columns say something actionable: the brand is visible, occasionally endorsed, thinly described, and sourced from its own docs rather than third-party validation. That's a documentation and review-coverage problem, not a positioning problem.
The mechanics are worth seeing before you build the log, because the discipline is in the repetition rather than the tooling.
The cited sources column is the one that points to action. If assistants describe a competitor using its documentation site and two review platforms, that reputation is built in three places you can influence: publish better comparison pages, earn review coverage, and get referenced in the third-party pages the assistant already trusts. Record which assistants were checked as well, because a prompt run on one platform says nothing about the others.
Entering numbers: fixed prompts, fixed platforms, one date range per chart. Change any of the three and you have a new baseline, not a trend line.
The LLM visibility tracking guide covers how to hold that baseline steady across months.
Recording Evidence Quality and Confidence
Competitor facts are not equally reliable. A chart that presents a verified pricing page and a marketing claim in the same typeface implies precision it doesn't have, and someone will make a pricing decision on the strength of it.
The problem shows up in practice, not just in theory. A 2026 survey of 103 competitive-intelligence practitioners reported recurring failures including missing competitors, comparisons built on incompatible figures, and global data being used to answer local-market questions, per Valona Intelligence's market and competitive intelligence report. In the same survey, 56% said they now spend more time reviewing and validating AI-generated intelligence, and 78% believed stakeholders trusted intelligence more after human review.
| Flag | Apply When | Example |
|---|---|---|
| Verified | Checked against a live page or primary filing | Pricing page captured 2026-10 |
| Self-reported | Claim comes from the competitor's own marketing | Uptime claim on the homepage |
| Dated | Source is older than the reporting period | Pricing page still showing the packaging retired at the last renewal |
| Market-specific | Value applies to one country or segment only | UK-only data residency certification |
| Not comparable | Definitions or units differ across companies | Price per seat against price per account |
Attach the flag to the cell, in the notes column, and write the date of the check beside it. For quantitative rows, add a confidence note: a range instead of a single figure when the sample is thin, and the sample size in the note. The rule that does the most work is simple. If a row carries two or more flags, don't compare it against another company's value until the definitions are aligned, no matter how clean the number looks.
Flags decay. A verified value becomes dated within a quarter or two, and a self-reported claim becomes verified the moment you confirm it on a live page. Set a review cycle for the rows that carry high flags, and let the ones marked not comparable stay visibly unresolved rather than being normalized. The guide to reliable citation analysis for AI search engines explains how to judge whether a cited source is authoritative and current before you trust the claim it supports.
Filling the Chart With Evidence and Avoiding Errors
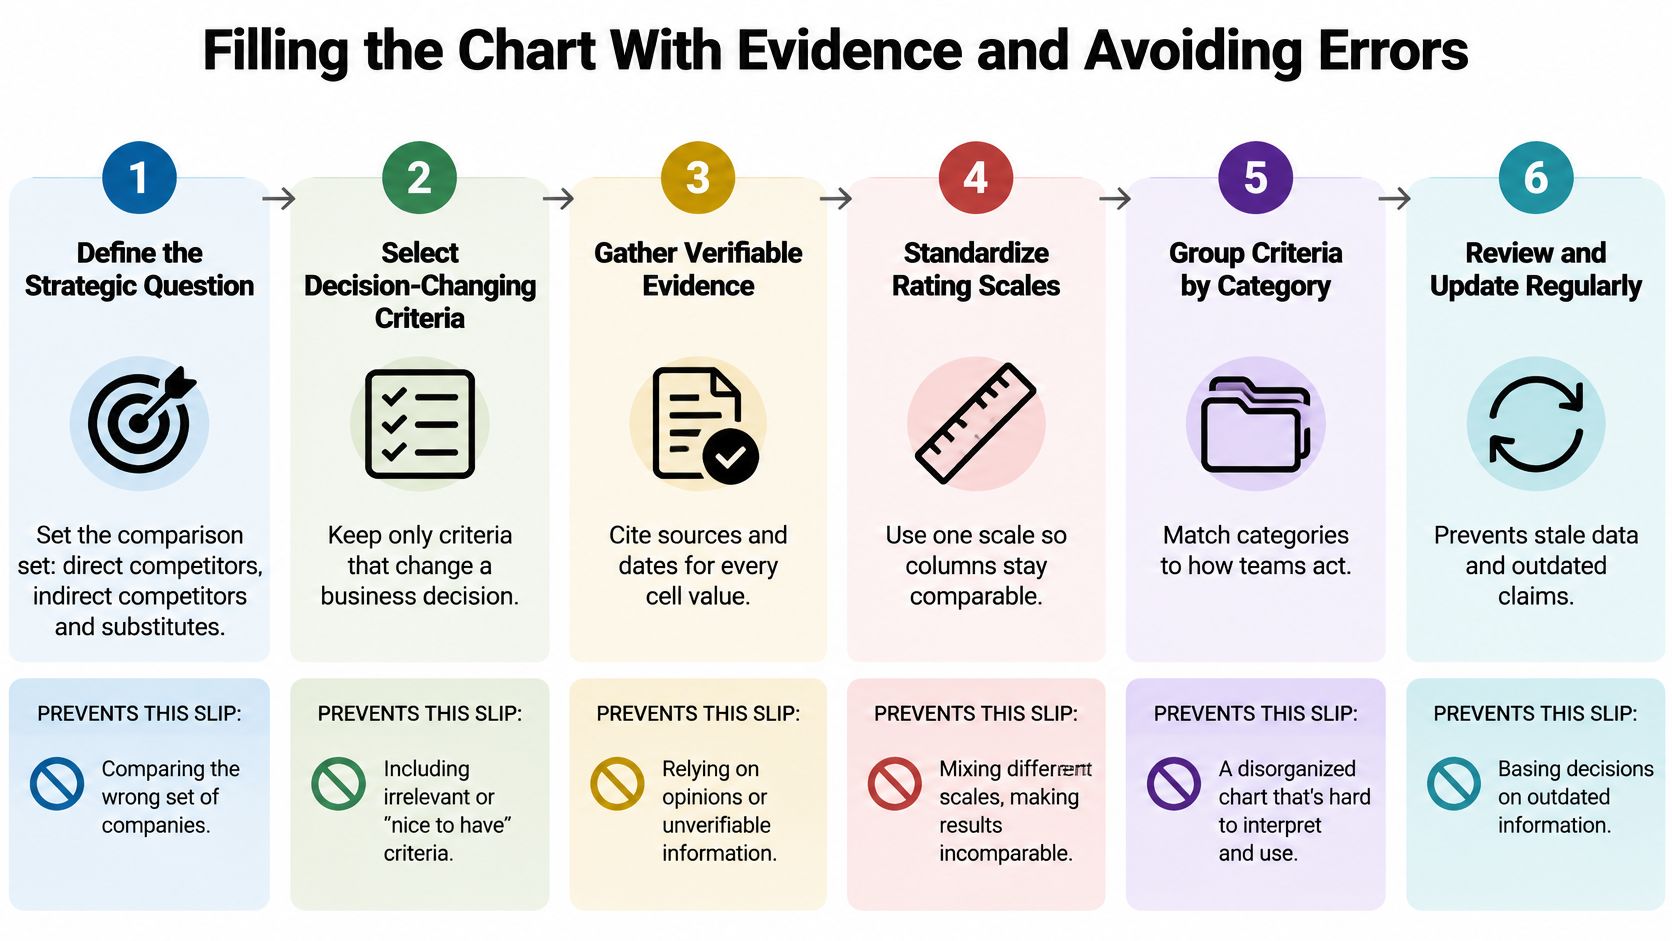
A competitive chart fails in the cells, not in the template. AI answer visibility needs the same discipline as price or features: prompt set, provider coverage, capture date and confidence all sit beside the value, because a mention count without that context is easy to misread.
Define the strategic question and the comparison set. Separate direct competitors, indirect competitors and substitutes so the chart answers one decision. Infomineo's competitive analysis framework guide splits the workflow into three auditable stages, assess, benchmark and strategize, with evidence validated before synthesis. The slip to watch is a comparison set that shrinks to the two best-known rivals, so revisit the list at every review and look for new entrants.
Standardize the criteria before collecting data. Same definitions, same units, same reporting period for every company. The slip is comparing a monthly price against an annual one, which produces a ranking that collapses the moment someone checks the billing page. Fix the billing unit first, then enter values.
Collect primary evidence first. Dated pricing pages, product documentation, review platforms and the logged AI answers for your tracked prompts. Secondary sources fill gaps and never lead. For AI visibility cells, record which prompts were run and which answers were captured, since a strong showing on three buyer prompts can hide absence across the rest of the set. The slip is copying a competitor's own marketing claim into the cell as though it were measured fact.
Record source, date and confidence for every value, and use a question mark for gaps. A page captured long ago will show a discontinued feature as current, which is how charts get confidently wrong. Leave the gap visible until someone closes it, and keep thin samples marked as thin rather than rounding them into certainty.
Score against fixed anchors, then mark the rows where evidence is weak. A score built on a self-reported claim deserves a visible caveat beside it, not a silent downgrade that nobody can trace. Treat AI answer cells the same way: a brand can look dominant because the prompts were easy, the providers were few, or the capture window was short.
Turn each gap into an action with an owner, a deadline and a success metric. Schedule the next review in the same meeting. A gap list without owners is a wish list.
Each of those fixes is a habit, not a one-time task. Keep a short changelog showing when a value changed and why, because the reason a number moved is often more useful than the number.
Cut without mercy: any row that no named decision uses. A long checklist with no owner is the most common way a competitive analysis chart stops informing decisions.
Scoring Scales and Weighting Rules
Write the anchors before anyone scores anything, or the person who likes a competitor's onboarding will find a way to rate it a four. Five points, fixed meanings, one example of supporting evidence recorded per rating.
| Score | Meaning | Example Evidence |
|---|---|---|
| 1 Absent | No evidence the capability exists | No API listed in documentation |
| 2 Limited | Exists with major gaps | Read-only API with no export |
| 3 Parity | Meets the common market standard | Standard CSV export and a documented API |
| 4 Strong | Exceeds the standard with documented proof | Full API plus webhooks, published in docs |
| 5 Leading | Category benchmark confirmed by users or tests | Top result in a third-party comparison |
Weighting and the Sensitivity Check
When a total score combines price, feature breadth, review sentiment and visibility, publish the weights inside the chart. A workable starting split is 30% commercial, 30% product, 20% sentiment, 20% visibility, with a one-line note explaining why the team chose it. Weights that live in someone's head can't be audited when the ranking gets challenged in a board meeting.
Then run the sensitivity check. Move each weight by ten points and see whether the top-ranked competitor changes. If it flips, report the result as a tie rather than a winner, because a ranking that depends on an arbitrary weight is an argument dressed as arithmetic.
The visual layer has rules too. Use a matrix or horizontal bars sorted by total score, start bar axes at zero, and keep category definitions identical across companies. The ACM paper on comparative chart design and measurement uncertainty documents how axis choices and mixed inputs exaggerate small gaps, and points to NIST's guidance on treating uncertainty probabilistically, which in practice means confidence bands or ranges on quantitative rows.
For any quantitative metric, document the normalization method and the missing-data treatment beside the score. If visibility carries a weight, the share of voice calculator is a quick check on the input before it enters the total. Keep the individual ratings visible next to the total, because a total score is a summary and summaries hide the disagreement that matters.
Reading a Filled-In Chart at a Glance
A finished chart looks settled and isn't. Read it in a fixed order and the disagreements surface in the right sequence.
| Criterion | Competitor A | Competitor B |
|---|---|---|
| Pricing model | Per-seat tiers from $49 to $199 per month | Per-account pricing from $600 per month (not comparable) |
| Customer sentiment | 4.2 average across 240 reviews, captured 2026-10 | 4.6 average across 60 reviews, self-reported and dated 2025-03 |
| AI answer visibility | Mentioned in 3 of 10 prompts, position 2 | Mentioned in 6 of 10 prompts, position 1 |
| Cited sources | Documentation site and two review platforms | Vendor blog and one review platform |
| Evidence quality | Verified, 2026-10 | Self-reported and dated, 2025-03 |
Start with the evidence quality row. A cell marked self-reported or dated carries less weight than a verified one, whatever the number says. Then compare only the rows that share a definition. Competitor B's price is per account, so it's flagged not comparable and can't be ranked against per-seat tiers until someone converts the billing unit.
Competitor B leads on sentiment and on AI position, which is the headline a sales team would run with. Its evidence is self-reported and dated, and the sentiment sample is a quarter of Competitor A's, so if the sensitivity check flips the lead, report a tie and say why. Question marks stay visible in the third competitor column, where missing evidence shows exactly which action from the gap list should fill it.
A finished chart shows complete rows for the core criteria, visible question marks everywhere else, and bars sorted by total score. Anything cleaner than that is a chart hiding its own uncertainty.
The competitive intelligence dashboard guide covers how to keep this view current between reviews instead of rebuilding it each quarter.
Build Your First Chart This Week
Pick one decision the chart must inform and name the person who will act on it. Copy the ten rows and cut them to that decision, aiming for six to eight. Choose three to five competitors, including at least one substitute, then fix five to ten buyer-intent prompts and record the platform and date of every check.
Enter values with their evidence flags, score each row against the anchors, and leave gaps as question marks. Book two cadences before you close the document: a monthly refresh of the AI visibility columns and the flags, and a quarterly re-test of the comparison set itself.
A platform such as MyMentions runs the prompt checks and lists the cited sources, which removes the manual logging from the monthly refresh. The trade-off is arithmetic: one prompt across eight providers uses eight provider checks from the daily limit, and the Starter plan at $49 per month covers 25 checks a day, so size the prompt list against the plan before committing to a wide provider set.
Set the first review date now, while the chart is still open on the screen.
MyMentions tracks how AI assistants mention, rank and describe your brand across buyer prompts, and compares that against the competitors you add, with citations and sentiment attached to each result. It turns the two rows most charts leave out, AI answer visibility and cited sources, into tracked data you can refresh on a schedule rather than guess at. Visit MyMentions to build the prompt set and see where your brand stands in the answers buyers are reading.