You're probably already feeling the problem.
A prospect asks why your product rarely shows up when they ask ChatGPT or Perplexity for recommendations. A sales rep says a competitor keeps appearing in late-stage deals. Your team has screenshots, notes, CRM comments, a few review site alerts, and maybe a spreadsheet somebody updates when they remember. None of it connects.
That's when a competitive intelligence dashboard stops being a nice-to-have and starts looking like basic operating equipment. It gives founders one place to see what competitors are doing, how buyers are encountering those competitors, and, increasingly, how AI assistants are describing the category in the first place. If you want a quick way to inspect how your brand appears in AI results before you build the full system, start with an AI visibility audit.
Table of Contents
- Why Founders Need a Competitive Intelligence Dashboard Now
- What a Competitive Intelligence Dashboard Actually Is
- Key Metrics and Data Sources That Drive Decisions
- Design and UX Principles for Dashboards People Actually Use
- How Founders Marketers and SEO Teams Use the Dashboard Daily
- How to Implement and Benchmark Your Dashboard the Right Way
- Putting Your Competitive Intelligence Dashboard to Work
Why Founders Need a Competitive Intelligence Dashboard Now
Founders used to get away with quarterly competitor reviews. You'd skim pricing pages, check launch announcements, collect a few call notes, then decide whether anything mattered. That worked when the competitive surface changed slowly and buyers mostly discovered vendors through search, outbound, and referrals.
That's not the world most software teams are in now.
A competitor can change packaging on Monday, publish a comparison page on Tuesday, get mentioned in AI answers on Wednesday, and show up in your pipeline by Friday. The issue isn't just speed. It's fragmentation. Pricing lives on one page, positioning on another, sentiment in reviews, and AI-era visibility inside answer engines your team may not be tracking at all.
The dashboard solves a coordination problem
A good dashboard doesn't exist to impress the board. It exists so your team can answer a short list of practical questions fast:
- What changed: Did a competitor alter pricing, launch a feature, or shift messaging?
- Where it matters: Is that change showing up in deals, reviews, search presence, or AI answers?
- How we respond: Do sales battlecards need updating, does product need a rebuttal page, or does content need better source coverage?
Without that shared view, every team works from partial evidence. Sales hears objections. Marketing sees website shifts. SEO spots ranking movement. Founders hear all of it separately and still have to guess what deserves action.
Practical rule: If a signal won't change what your team ships, says, or prioritizes, it doesn't belong on the dashboard.
Why timing matters more than ever
Competitive intelligence has become a budgeted strategic capability, not just an analyst side project. One industry summary estimates the broader market at about $50.87 billion in 2024 and projects $122.77 billion by 2033, while a tools-focused estimate values the competitive intelligence tools market at USD 0.59 billion in 2025 and projects USD 1.46 billion by 2030, with North America largest and Asia Pacific fastest-growing, according to this competitive intelligence market summary.
The more important shift for founders is practical, not financial. Buyers now meet your brand in two places at once: in deals and in AI-generated answers. If you only track traditional competitor moves, you miss a growing part of how evaluation happens.
What a Competitive Intelligence Dashboard Actually Is
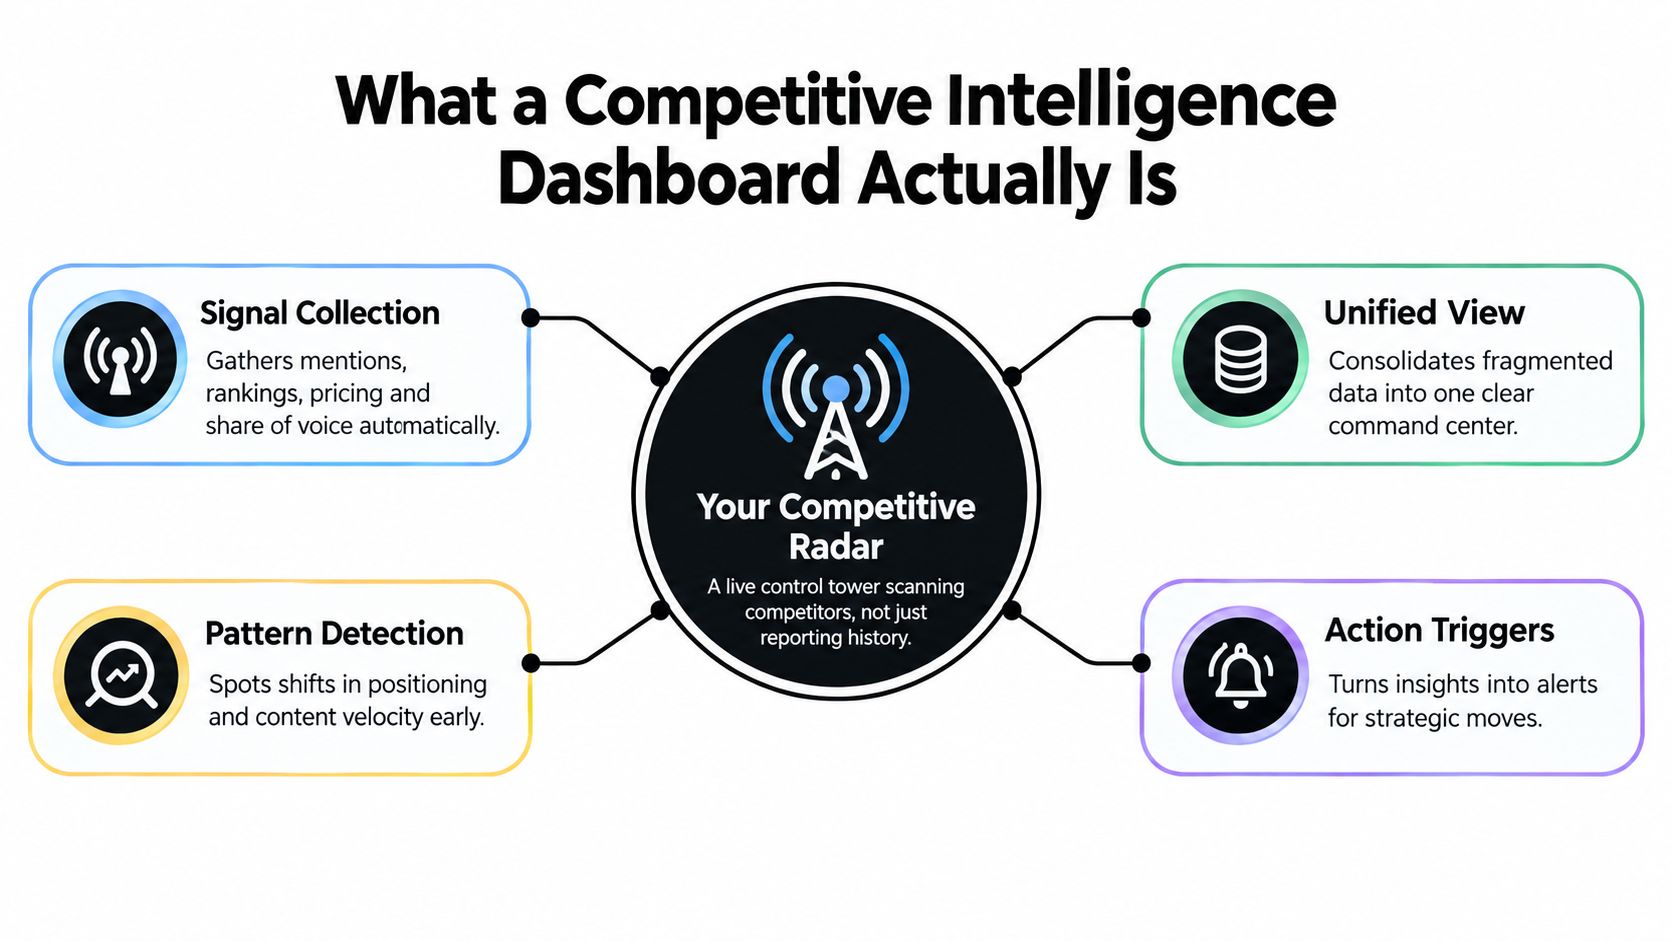
Think of a competitive intelligence dashboard like an airport control tower. Planes are always moving, but the job of the tower isn't to admire movement. It's to keep the right signals in one view so people can make safe, fast decisions.
A competitive intelligence dashboard does the same for your market. It pulls scattered competitor signals into one operating view so founders, sales leaders, product marketers, and SEO teams can see what changed and decide what to do next.
It's not a static report
A report tells you what happened. A dashboard helps you operate.
A spreadsheet of competitor notes isn't a dashboard. Neither is a slide deck someone refreshes before the quarterly planning meeting. Those are archives. Useful, sometimes. But they don't function as a live system.
Modern dashboard practice has converged around a few common metrics and a single-source-of-truth model. One dashboard guide describes these systems as centralizing competitor signals, win and loss rates, battlecard engagement, and market movements into real-time metrics used by sales, product, and CI teams in one shared workspace, as outlined in this competitive intelligence dashboard glossary.
It has three jobs
Most effective dashboards do three things well.
Collect live signals
They gather information from places your team would otherwise check manually. That can include CRM notes, review sites, pricing pages, changelogs, hiring signals, and AI answer data.
Detect patterns early
One pricing change rarely matters on its own. But pricing plus a new positioning page plus fresh AI mentions can signal a strategic move. The dashboard helps your team connect those dots before the market narrative hardens.
Trigger action
The dashboard should lead somewhere concrete. Update the homepage copy. Create a rebuttal page. Brief sales on a new objection. Investigate why AI assistants cite competitor docs instead of yours.
A dashboard is useful when it shortens the distance between signal and response.
The AI-era expansion
The old version of competitive intelligence mostly asked, “What are rivals doing?”
The newer version adds a second question. “How are AI assistants representing us versus rivals?” That means mentions, citations, answer framing, and prompt-level visibility now belong beside traditional signals like packaging, pricing, features, hiring, and reviews.
That's the shift many teams haven't fully operationalized yet. They're still monitoring competitors as companies, but not as entities that are constantly being summarized by machines.
Key Metrics and Data Sources That Drive Decisions
The easiest way to ruin a dashboard is to treat it like a storage unit. Teams dump in everything they can measure, then wonder why nobody uses it.
A cleaner rule works better: track only what would change a decision.
Expert guidance on dashboard design recommends focusing on decision-grade signals such as total mentions by competitor, trend direction, and whether mentions are favorable or unfavorable, while also including changes in pricing, packaging, positioning, features in deals, SEO and marketing presence, hiring, funding, and sentiment only when movement would lead your team to act, as explained in this guide to building a competitive intelligence dashboard.
Start with the signals closest to revenue
If you're a founder, begin with the metrics that connect directly to pipeline and market perception.
| Metric | Primary Source | Decision It Informs |
|---|---|---|
| Competitive win rate | CRM, closed-lost notes, win/loss interviews | Whether positioning or product gaps are costing deals |
| Competitor presence in active pipeline | CRM fields, call recordings, rep notes | Which rivals deserve immediate monitoring and battlecard updates |
| Battlecard engagement | Enablement platform, internal docs usage | Whether sales is actually using the materials you created |
| New competitive signal volume | News feeds, changelogs, pricing pages, review monitoring | Whether a competitor is accelerating activity |
| Recurring win/loss themes | Interviews, Gong notes, call summaries | Which objections repeat often enough to require a strategic fix |
| Pricing and packaging moves | Competitor website, archived pages, sales call screenshots | Whether to adjust packaging, discounting, or comparison content |
| Feature mentions in deals | CRM, demos, rep notes | What buyers think matters most right now |
| Hiring and funding signals | Public job boards, company updates, investor pages | Whether a competitor is pushing into a new segment or capability |
| Sentiment and answer framing | Review platforms, AI answer monitoring, social listening | How the market describes each vendor and where trust gaps exist |
Add AI visibility metrics, but keep them disciplined
Many newer dashboards either get too shallow or too messy.
You don't need endless prompt screenshots. You need a stable benchmark. For AI-facing competitive intelligence, strong frameworks recommend measuring prompt-level coverage across a fixed competitor set, establishing a baseline, then tracking mention rate, citation rate, share of voice, sentiment, and change over time. One framework defines AI share of voice as brand citations divided by total category citations and suggests tracking 20 to 50 category-relevant prompts across 5 to 10 competitors for fair comparison in this AI share of voice framework.
That advice matters because AI answers can be noisy. If you change prompts every week, you can't tell whether your visibility changed or your test did.
A practical filter for founders
Use this quick decision matrix when choosing metrics:
- Must-track now: Signals tied to deals, positioning, and buyer discovery.
- Track next: Signals that help explain movement, such as hiring or review trends.
- Nice-to-have later: Signals that are interesting but rarely trigger action.
Here's what that usually looks like in practice:
- For founder-led sales teams: Win rate, competitor presence in pipeline, recurring objection themes, AI mention rate.
- For product marketing teams: Battlecard engagement, pricing and packaging shifts, answer framing, feature mentions.
- For SEO and content teams: Citation sources, share of voice, prompt coverage, sentiment direction. If your team is building this layer, this overview of AI search analytics is a useful companion because it maps prompt-level monitoring to content decisions.
Where readers usually get stuck
They assume more sources means better intelligence. It usually means more noise.
Start with the sources your team already trusts:
- Internal systems: CRM, sales notes, win/loss interviews
- Public web: competitor sites, pricing pages, release notes, review platforms
- Discovery channels: SEO data, brand monitoring, AI answer outputs
- Market clues: hiring pages, partner listings, public announcements
If a source consistently produces interesting but non-actionable observations, remove it from the main view and keep it in a research tab instead.
Design and UX Principles for Dashboards People Actually Use
Most dashboard failures aren't data failures. They're design failures.
Teams open the page, see too many widgets, don't know where to look, and stop trusting the system. Good dashboard UX solves that by making meaning obvious at a glance.
Put the answer before the evidence
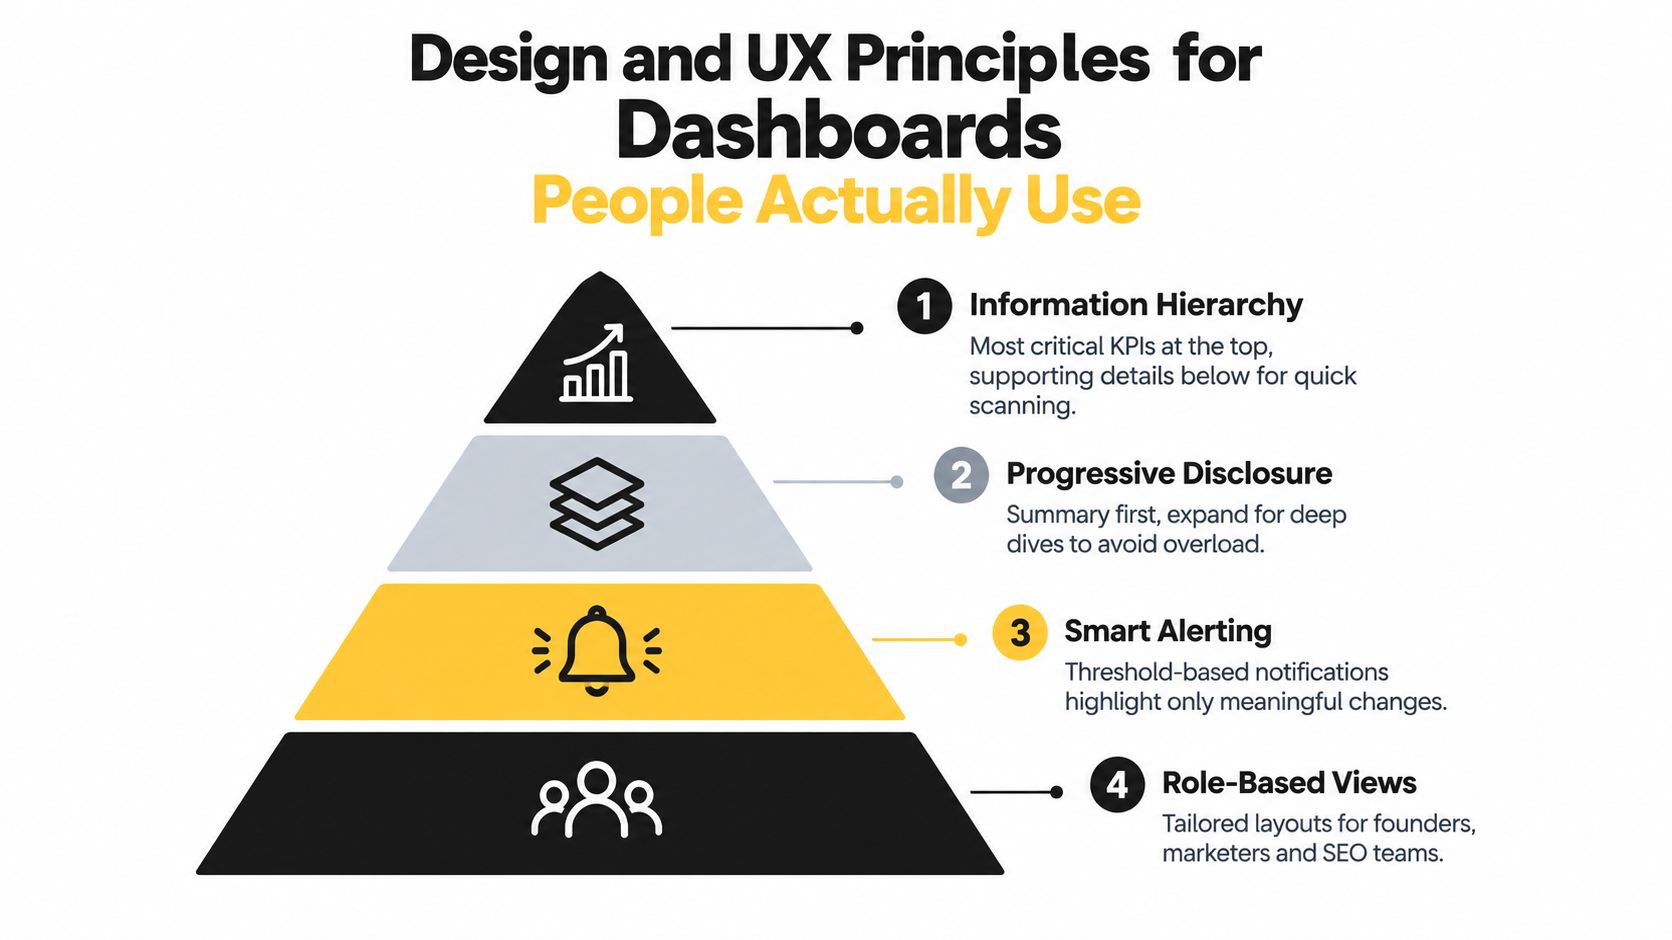
Your top row should answer the question, “Do we need to pay attention today?”
That usually means a tight summary of market movement, competitor momentum, and AI visibility changes. Detailed evidence can sit underneath. Founders should see the headline first, then drill down if something looks off.
A simple layout that works
A practical structure for a competitive intelligence dashboard often looks like this:
- Market overview with key movement and alerts
- Competitor comparison showing relative position
- Drill-down panels for pricing, messaging, citations, or sentiment
- Action backlog with assigned next steps
This pattern works because it mirrors how teams think. First, “what changed?” Then, “who caused it?” Then, “what exactly happened?” Finally, “who owns the response?”
Use progressive disclosure
Don't put every chart on the front screen.
A founder may want one-click access to pricing shifts and AI share of voice. A content strategist may need citation source detail and prompt-level answer snapshots. Both can live in the same system, but not in the same visual layer.
Design test: If a first-time viewer can't tell what needs action in under a minute, the dashboard is too dense.
Make movement scannable
Trend lines are often more useful than raw totals. A flat but healthy signal is different from a sudden drop. Use simple visual cues for direction, not decorative clutter.
For inspiration on how teams simplify operational views, it helps to browse sales dashboard examples from Yalc. Not because sales and CI are identical, but because both succeed when the most decision-critical metrics are visible immediately.
Build role-based views
One dashboard can support several audiences if each view respects their job.
- Founders: Threats, category movement, AI visibility versus top rivals
- Marketing leaders: Messaging shifts, campaign themes, content gaps
- SEO teams: Citations, prompt coverage, answer framing, source quality
A customizable setup matters here. If you're designing views for different teams, these ideas on customizable SEO dashboards are useful because they show how to tailor one system without creating separate reporting sprawl.
How Founders Marketers and SEO Teams Use the Dashboard Daily
The same dashboard means different things depending on who opens it.
A founder looks for risk. A marketer looks for messaging clues. An SEO lead looks for source patterns. The system works when each person can move from signal to action without translating the whole market for themselves.

How founders use it
A founder notices that one rival keeps appearing in sales calls and AI-generated category answers. The dashboard shows three things in one place: sharper positioning language on the competitor site, stronger citation coverage from third-party review pages, and more frequent mentions in active pipeline notes.
That combination changes the response. This isn't just “a competitor seems louder lately.” It becomes a concrete operating decision: rewrite homepage positioning, arm sales with a clearer comparison narrative, and improve trust-building content that outside sources can cite.
How marketers use it
A product marketer opens the dashboard after a rough demo week. Reps say buyers keep using a competitor's phrase to describe a core feature category. The dashboard confirms that the phrase appears in competitor pages, review snippets, and AI answers more often than the team expected.
The fix is usually not a giant rebrand. It's smaller and faster. Update comparison pages, revise campaign copy, tighten battlecards, and publish content that frames the category on your terms.
Sometimes the most valuable insight is that the market is repeating your competitor's language back to you.
A dashboard also keeps battlecards honest. If the team built rebuttal material months ago but usage is low and objection themes have shifted, the dashboard makes that visible before more calls go sideways.
How SEO and content teams use it
SEO teams are often the first to spot the AI-era version of competitive intelligence. They see that your brand is technically present online but missing from the sources AI assistants appear to trust.
That changes the workflow. Instead of chasing rankings alone, the team inspects which pages, reviews, partner listings, documentation, and educational assets are shaping answers. Tools in this category can help. For example, MyMentions tracks prompt-level visibility across AI providers, compares brands against competitors, and surfaces the citation sources shaping those answers.
After the source pattern becomes clear, content work gets sharper. The team updates help docs, expands entity-rich pages, improves comparison content, and fills obvious citation gaps rather than publishing generic top-of-funnel articles.
Here's a useful walkthrough on how teams think about this in practice:
The shared habit across teams
The dashboard works best when each team checks it on a predictable cadence.
Founders may review it weekly. Marketers may use it before launches and message updates. SEO teams may watch it continuously for shifts in mentions, citations, and answer framing. The important part isn't everyone using it the same way. It's everyone using the same underlying reality.
How to Implement and Benchmark Your Dashboard the Right Way
Teams often fail not because they picked the wrong charts, but because they never defined the benchmark clearly enough to trust what changed later.
A dashboard without a benchmark works like a scoreboard with no opening score. You can see motion, but you cannot tell whether you are gaining ground, losing it, or just measuring differently than last week.
Define the universe first
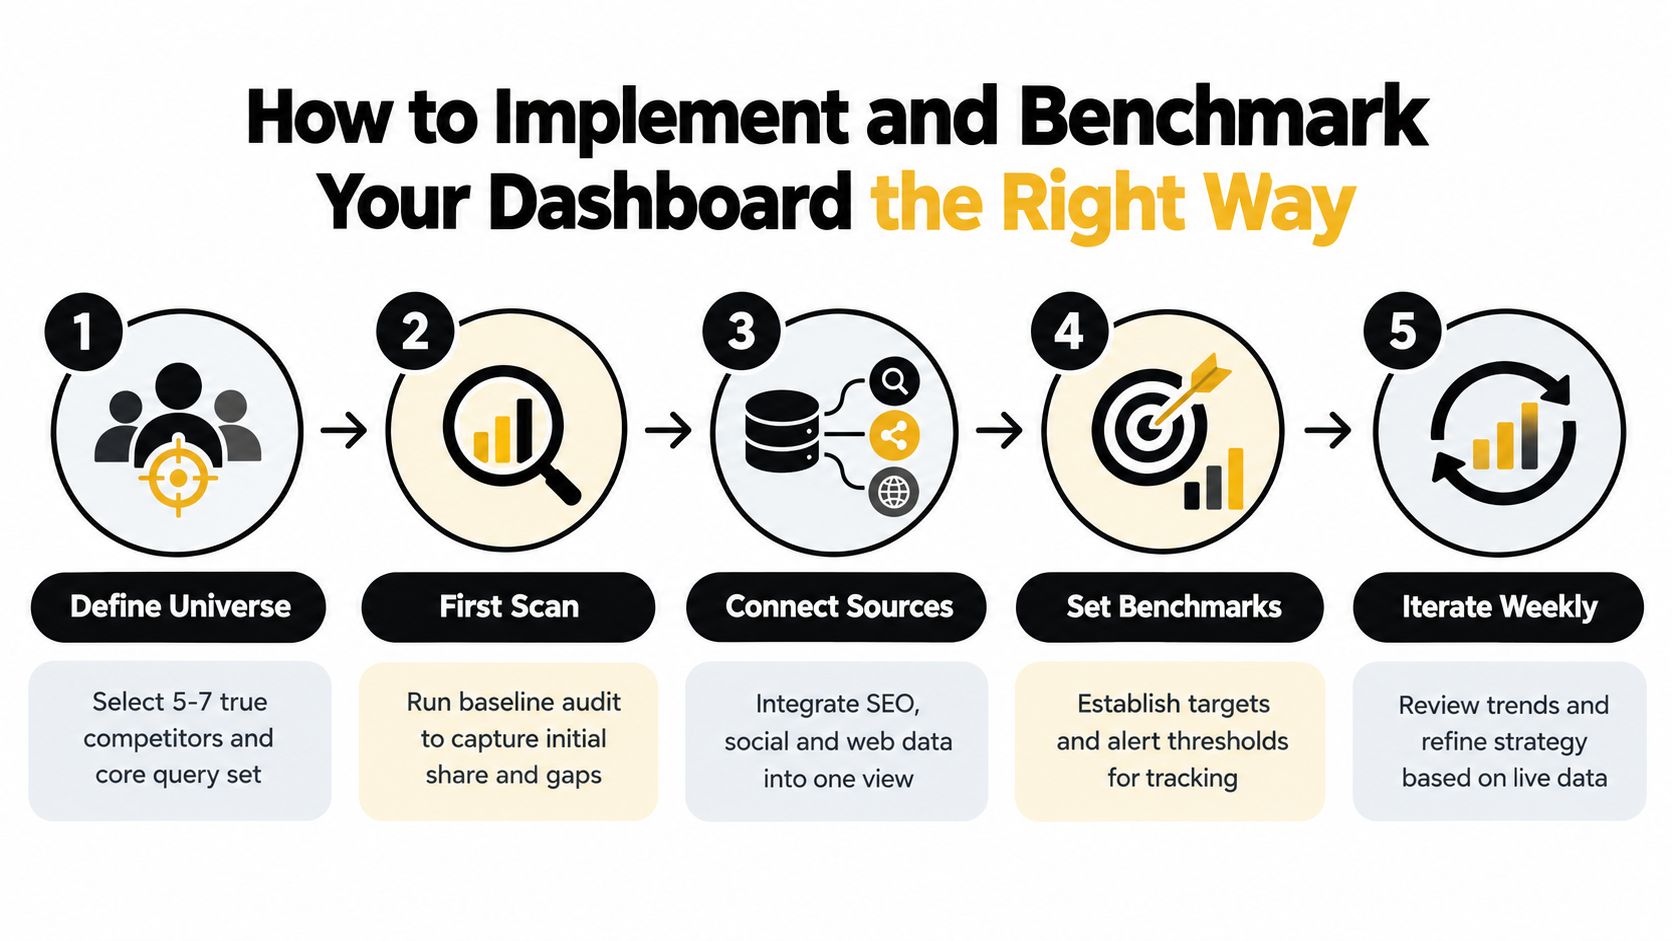
Start by deciding who belongs on the board. Include direct rivals, companies that keep appearing in live deals, and brands that AI assistants mention in category answers, even if your team has not treated them as core competitors before.
That last group matters more now. In the AI era, a competitor is not only the company with similar pricing or features. It is also the brand that keeps getting cited, recommended, or framed as the safe default inside AI answers.
Set your prompt and query library early and keep it stable. If one month you ask broad category questions and the next month you switch to product-specific prompts, your trend line stops being a trend line. It becomes two different tests.
Your setup checklist
- Choose a stable competitor set: Include the companies buyers compare you against most often.
- Build a prompt and query library: Keep category, alternative, comparison, and use-case prompts separate.
- Create a consistent tagging schema: Label prompts, competitors, sources, and sentiment the same way every time.
- Capture a first-scan baseline: Save the initial state before optimizing anything.
- Decide ownership: Someone has to maintain definitions, alert rules, and review cadence.
If you want a broader grounding in side-by-side market setup, this guide to competitor benchmarking is a useful companion.
Establish the baseline before you optimize
This is the step teams skip when they are in a hurry.
Run the first scan and freeze it. For traditional competitive intelligence, that baseline may include pricing, positioning, review sentiment, and sales-deal presence. For AI visibility benchmarking, it should also capture mention rate, citation rate, share of voice, sentiment, and answer framing across the same fixed prompt set.
Now your team has a starting line. Later, when a competitor suddenly appears in more AI answers or your brand starts getting cited from stronger sources, you can point to a real shift instead of arguing from memory.
Keep the data model boring
Boring wins here.
Use one naming standard for competitors. Use one rule for classifying prompts. Use one method for source attribution. Use one definition for what counts as a mention, a citation, and a favorable answer frame.
Otherwise, your dashboard starts reporting changes created by your tagging habits instead of changes happening in the market. That is how teams waste a month chasing noise.
Reliability matters more than novelty. A slightly simpler dashboard with consistent definitions beats a complex one nobody trusts.
Choose build versus buy with the use case in mind
A lightweight stack can work if your goal is a shared operating view for pricing, messaging, deal feedback, and market activity. Many early-stage teams can get there with CRM fields, shared docs, alerts, and a BI layer.
The bar is higher if you want prompt-level AI visibility benchmarking. Tracking which assistants mention your brand, which sources they cite, how often competitors appear, and how the answer is framed creates a lot of manual work fast. In that case, dedicated software can save time and reduce inconsistencies.
Tool choice is only part of implementation. You also need to set refresh cadence, alert logic, and reporting rules before launch. If updates depend on someone remembering to clean a spreadsheet, the system usually drifts within a few weeks.
Review and govern it like an operating system
The best dashboard is not the one with the most panels. It is the one your team can keep clean.
A simple review rhythm usually works best:
- Weekly review: check major movement and assign responses
- Monthly cleanup: archive dead metrics and tune alert thresholds
- Quarterly reset: revisit competitor set, prompt library, and stakeholder needs
Governance matters because benchmarks decay. A new competitor enters the category. Prompt wording changes. Source attribution rules get fuzzy. Before long, the dashboard still looks active, but the comparisons are no longer fair.
Keep the benchmark clean, and the dashboard stays decision-ready.
Putting Your Competitive Intelligence Dashboard to Work
A competitive intelligence dashboard earns its place when it changes what your team does next.
That's the simplest test. Did it help sales handle a live objection better? Did it show marketing which message the market was absorbing? Did it help SEO find the sources shaping AI answers? If not, it may be collecting information without producing decisions.
For the first month, keep the scope tight:
- Week one: define competitors, prompts, and decision-grade metrics
- Week two: capture your baseline and remove vanity signals
- Week three: set alerts for meaningful movement only
- Week four: ship a few fixes, especially around citation gaps, comparison content, and stale battlecards
The most useful dashboards don't separate traditional competitor tracking from AI visibility. They combine both. Pricing and packaging still matter. So do reviews, hiring, and pipeline presence. But now you also need to know how AI systems mention your brand, which sources they rely on, and whether competitors control the framing of your category.
If you're deciding what tools belong in that workflow, this roundup of AI competitor analysis tools can help you compare options and choose a setup that fits your team.
MyMentions gives founders, marketers, and SEO teams a live way to track how AI assistants discover, rank, and describe their products versus competitors. It combines prompt-level visibility, share of voice, average rank, sentiment, and citation-source analysis in one workspace so your dashboard can drive real fixes instead of static reporting. If that's the layer you're missing, visit MyMentions.