You're revising your deck the night before a partner meeting. The product story is sharp, the forecast balances, then you reach the competition slide and see a tidy grid of logos, checkmarks, and your company winning every row. You know an investor will not believe it, but you're not sure what evidence would make them believe you instead.
Table of Contents
- Why Most Competitive Slides Fail in a Business Plan
- Setting Up the Research Scope and Decision Questions
- Building the Competitor Matrix Investors Actually Read
- Choosing Metrics That Tie to Decisions
- Sizing the Market with Public Data and Honest Ranges
- Turning Findings Into a SWOT and a Risk Register
- Packaging the Section and Setting a Refresh Cadence
Why Most Competitive Slides Fail in a Business Plan
I've flipped past that slide more times than I can count. The founder spent weeks on pricing and product, then pasted in six logos at midnight. It tells me who exists. It tells me nothing about whether this market can support another company or why this one should win.
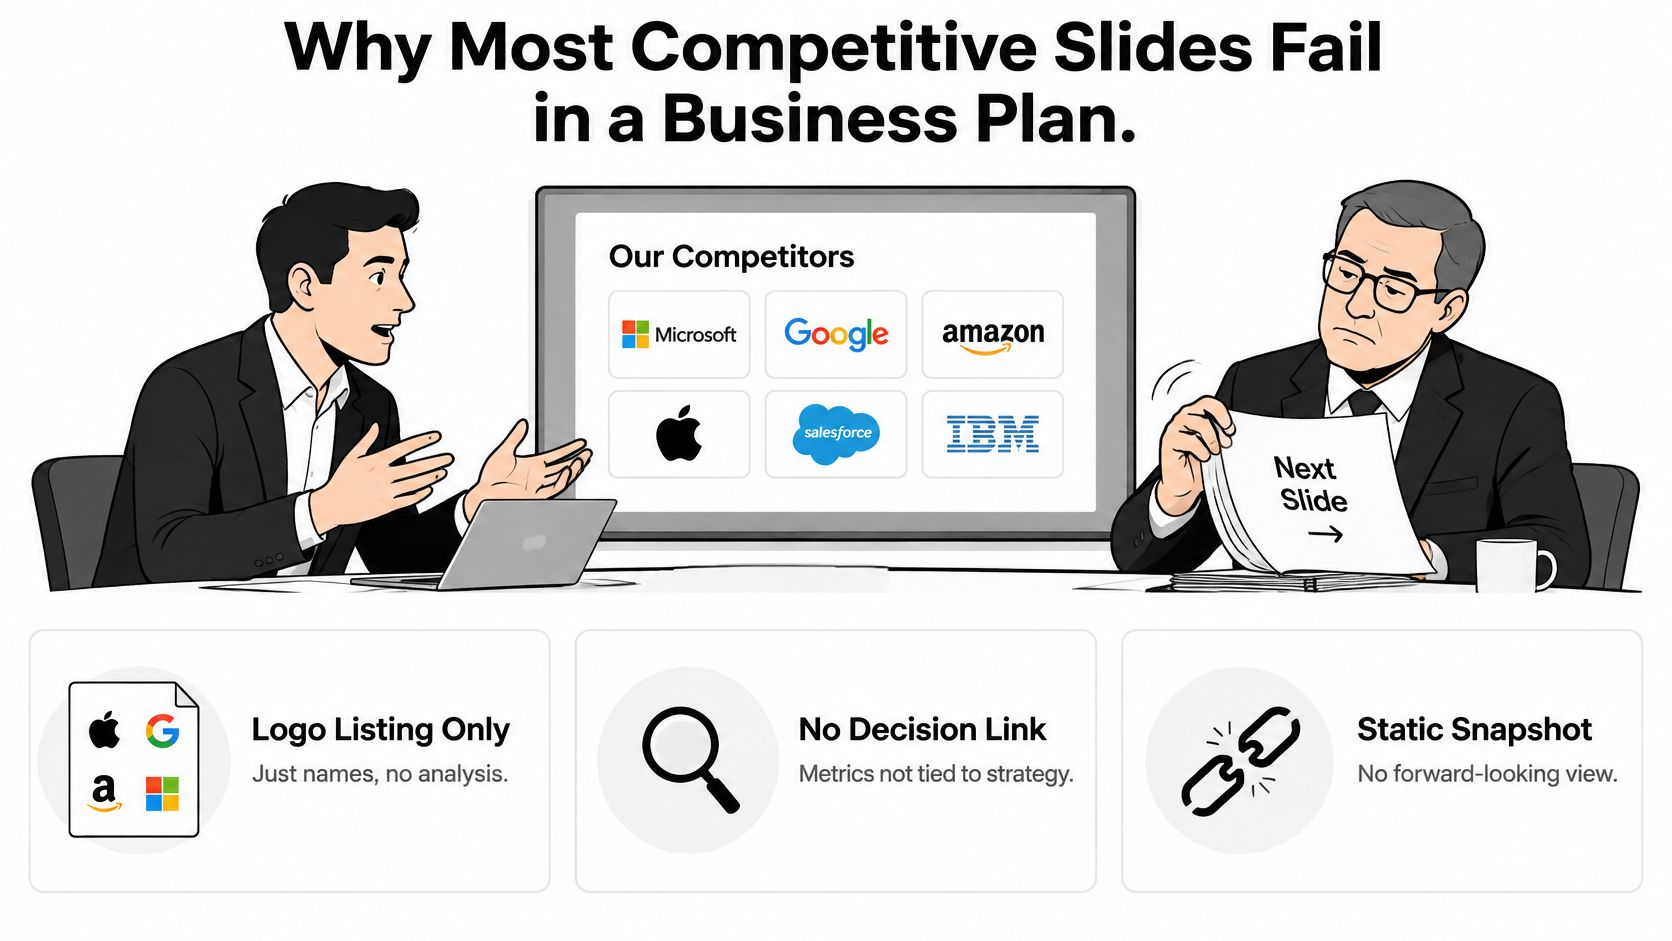
Three failure modes show up again and again. Cut all three.
- Logo listing only: You name direct rivals but skip substitutes, internal workarounds, and the status quo, which often captures more buyers than any named vendor.
- No decision link: You collect features and prices without saying what you'll do differently because of them, such as which segment to prioritize or which content gap to close.
- Static snapshot: You present one undated view with no owner, no refresh date, and no way to tell a durable advantage from a temporary campaign.
What an Investor-Grade Section Must Prove
A strong competitive analysis business plan section proves four things. The market is attractive enough to enter. There's a specific gap you intend to own. You understand the forces that could erode that gap, including buyer power and switching costs. Every claim has an evidence trail a diligence call can verify.
If you're assembling the full document around that section, an investor-ready UAE business plan outline is a useful reference for how the competitive section should sit alongside market sizing and financials, rather than floating as a standalone slide.
If your row wins every column, you've written marketing copy, not analysis. Investors discount the whole section the moment they spot it.
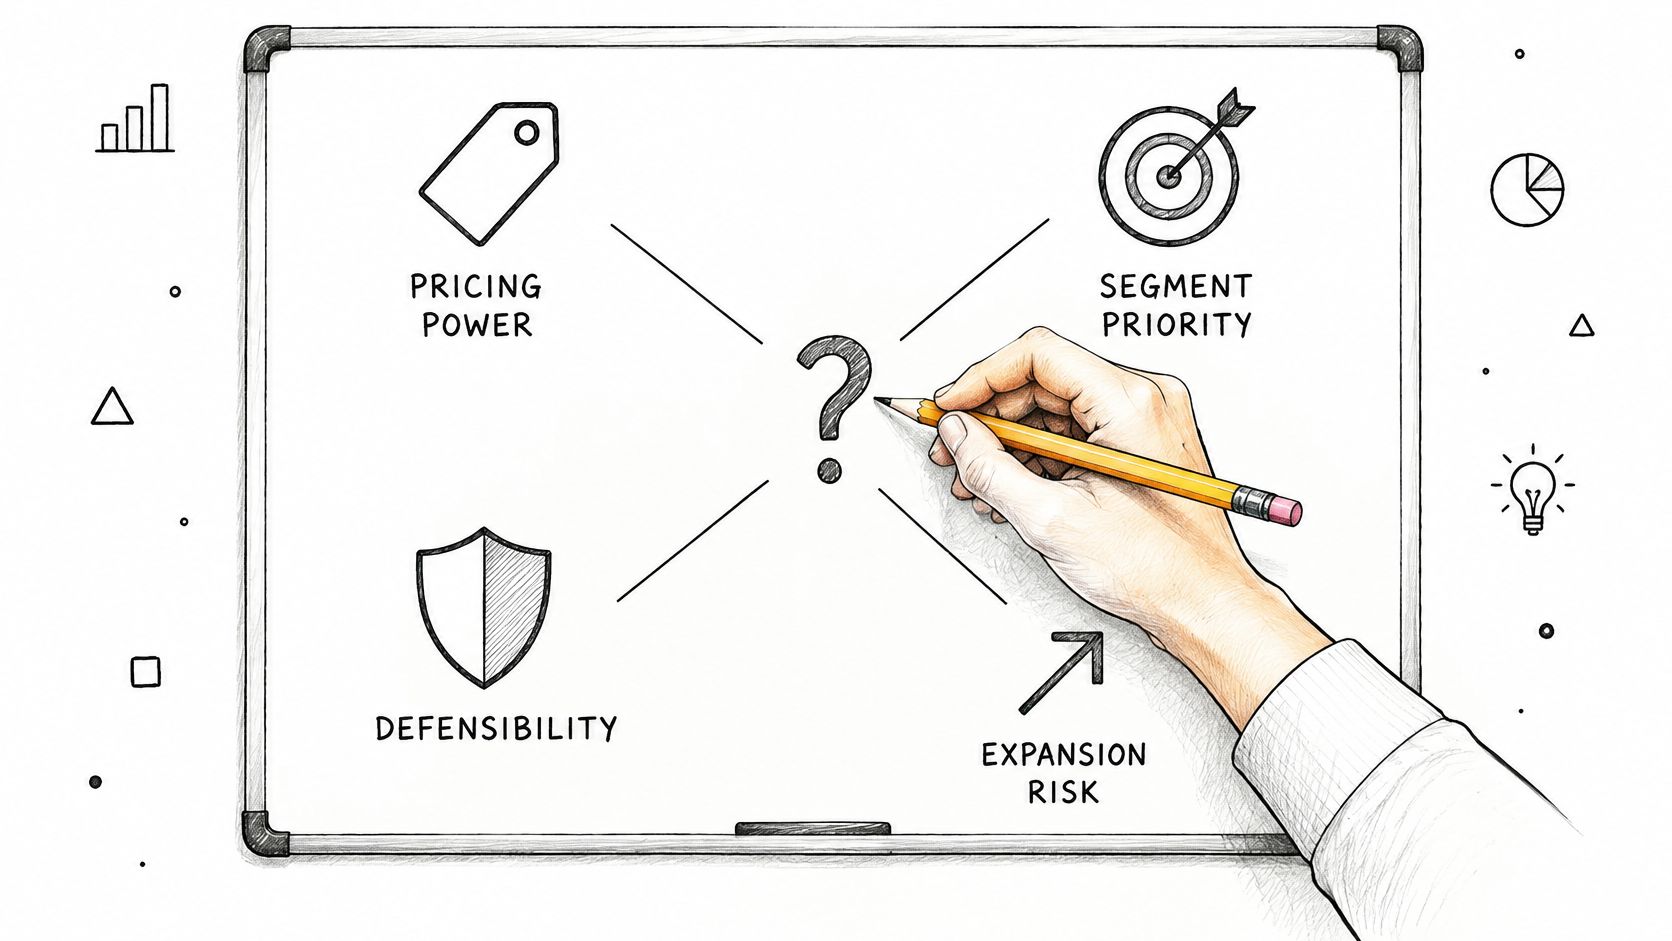
Treat this as a decision system, not a writing exercise. Start from the decisions your plan must defend, pricing, segment choice, defensibility, and expansion timing, then collect only the evidence that changes one of those decisions. Everything else belongs in an appendix or nowhere.
Setting Up the Research Scope and Decision Questions
Don't open a spreadsheet yet. Write your decision questions first. Can you hold price if a larger rival discounts? Which segment do you serve first? What stops a new entrant copying you next quarter? Each question dictates which competitors and which data you need.
Use Porter as a Scope Test Not a Lecture
Competitive analysis became a foundational planning discipline through Michael Porter's framework, first published in the March to April 1979 issue of Harvard Business Review, volume 57, number 2, pages 137 to 145. Its five forces are rivalry among existing competitors, threat of new entrants, bargaining power of buyers, bargaining power of suppliers, and threat of substitutes.
Translate each force into one plan question. Buyer power becomes, can customers pressure your price because switching is easy? Supplier power becomes, does a provider dependency constrain your margin? Substitutes become, what do buyers use today instead of you, including spreadsheets and doing nothing? That translation is the point. Listing the five forces without answering them adds a page and no information.
Lock the Peer Set Before You Collect Data
The U.S. Small Business Administration recommends identifying competitors by product line and market segment, then assessing market share, strengths and weaknesses, the window for market entry, the importance of the target market to competitors, entry barriers, and indirect or secondary competitors, as set out in its market research and competitive analysis guidance.
Use that list to lock scope in writing before research starts.
- Geography and segment: Name the exact markets and buyer segments in scope, and exclude the rest explicitly.
- Tier mix: Decide whether you're comparing free plans, paid plans, or both, and don't mix them in one row.
- Sampling window: Set the date range and data vintage so a later refresh measures change, not a new methodology.
- Competitor families: Separate direct rivals, indirect competitors, substitutes, and internal alternatives into distinct groups.
That separation matters because the work differs by question, which is why clarifying competitive intelligence versus market research early keeps your team from collecting broad market trivia when you need competitor-specific evidence. Once scope is locked, stop expanding the peer set unless a decision question changes.
Building the Competitor Matrix Investors Actually Read
Build one matrix, not five disconnected tables. Every competitor gets judged on identical criteria, identical segments, and, for AI discovery, identical buyer-intent prompts. Inconsistent inputs are the fastest way to manufacture a fake advantage.
Split Direct Rivals From Substitutes
Keep direct SaaS competitors in one block and substitutes plus internal alternatives in another. Combining them distorts pricing and positioning conclusions, because a spreadsheet doesn't compete on features, it competes on cost and inertia. For a consumer example of the same discipline applied to a crowded marketplace, teams that compare Etsy POD niches separate head-on sellers from adjacent categories before judging saturation, and your matrix should enforce the same split.
Competitor Matrix Columns for a Business Plan
| Competitor | Target Segment | Pricing Model | AI Visibility | Weakness | Threat to Us |
|---|---|---|---|---|---|
| Direct rival | Named buyer persona | Plan structure and tier | Share of voice and answer position | Verified gap from reviews or tests | Specific segment or deal type at risk |
| Adjacent tool | Overlapping persona | Bundled or add-on pricing | Citation sources cited | Limited depth in your category | Expansion into your core use case |
| Substitute or internal workflow | Team doing it manually | Labor cost, no license fee | Not recommended by AI assistants | Slow, inconsistent, unmeasured | Delays purchase indefinitely |
| Your company | Priority segment first | Your actual tiers | Your measured baseline | One credible weakness, stated plainly | Not applicable, state your mitigation |
Add AI Discovery Columns
Buyers don't evaluate you only on your website anymore. Add columns for AI share of voice, average answer position, citation-source coverage, and sentiment alongside pricing, positioning, distribution, and target persona. Run the same prompts for every row and record the provider, date, and exact wording.
Practical rule: Choose positioning map axes before you plot anyone, and pick axes buyers actually decide on. A price and quality map where everyone claims high quality tells an investor nothing.
For the mechanics of running that comparison consistently, a structured approach to how to do competitor benchmarking helps you keep prompts, segments, and scoring stable across refreshes. Two distortions ruin otherwise good matrices. Don't mix free and paid tiers in one pricing cell, and don't compare competitors across different geographic markets as if prices and availability transfer cleanly.
Put one honest weakness in your own row. No local reputation, limited provider coverage, thin content in a segment that matters. That single cell makes every other claim in the matrix more believable.
Choosing Metrics That Tie to Decisions
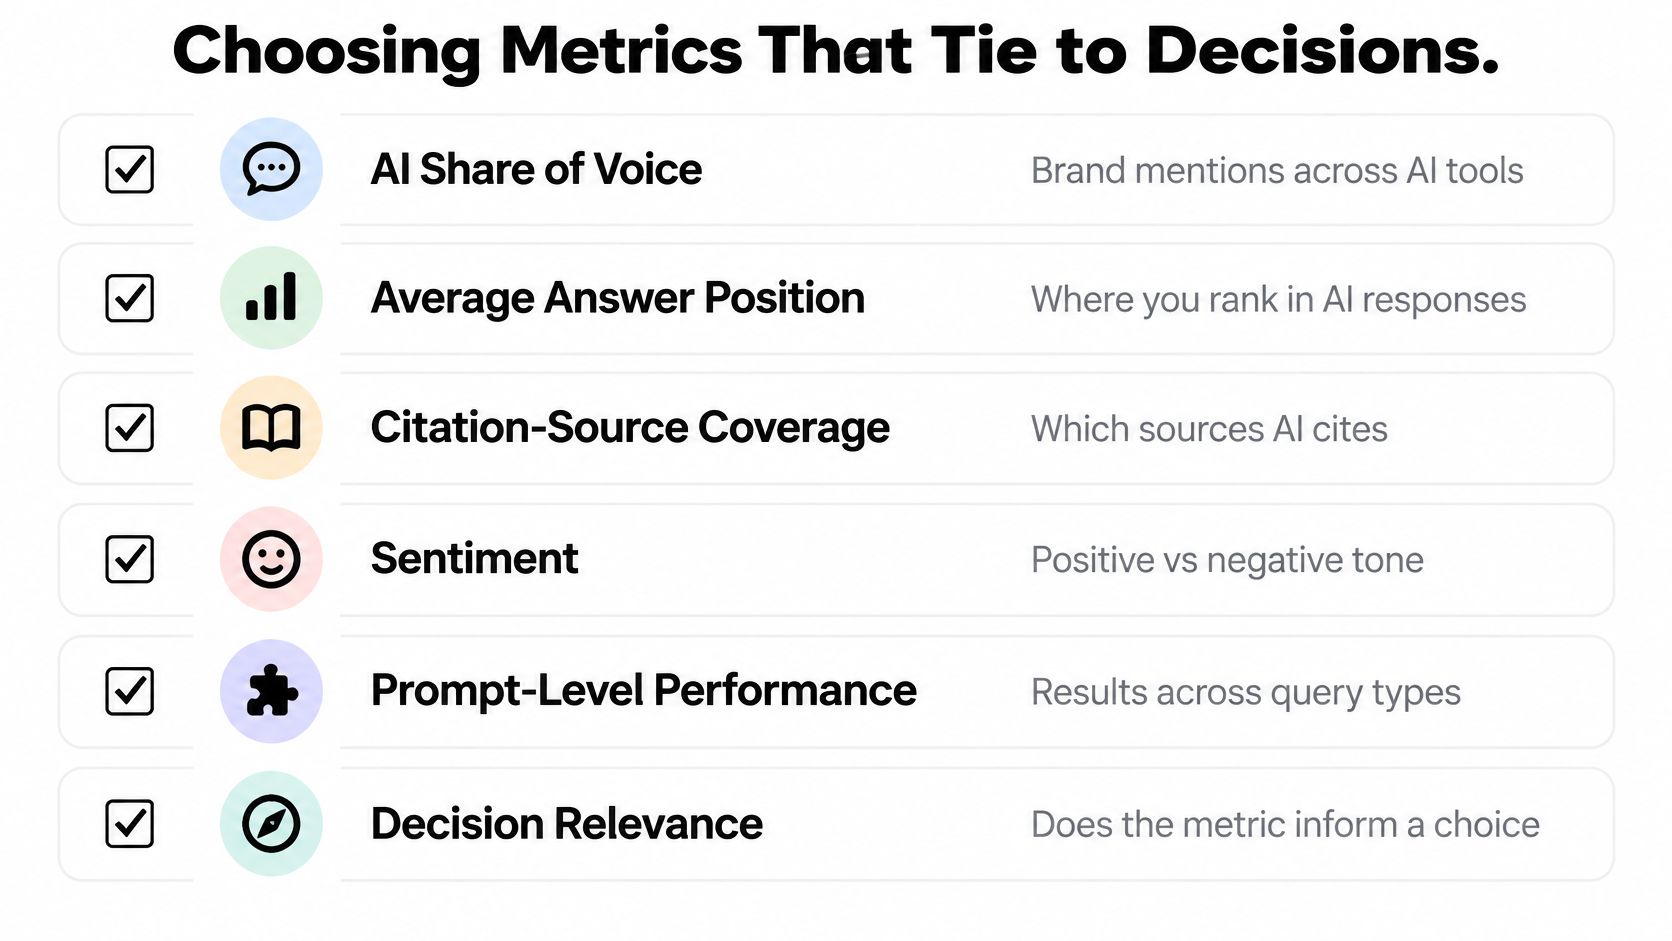
Most founders track too many metrics and act on none of them. Pick 5 to 8 core measures and tie each one to a commercial decision, following the approach in benchmarking guidance that recommends selecting metrics tied to decisions rather than tracking every available measure.
The checklist below shows a compact metric set built for AI-mediated discovery.
Define Each Metric Before You Measure It
For every metric, document the formula, sampling window, provider coverage, and data vintage. Start with AI share of voice, average answer position, citation-source coverage, sentiment, prompt-level win rate, attributed visits, and conversion rate. Then cut any metric that doesn't change a decision about content, segment priority, pricing, or product.
Weight buyer-intent prompts more heavily than informational prompts in a normalized visibility index. A mention in a category comparison prompt is closer to revenue than a mention in a definition prompt, and your scoring should reflect that. MyMentions is one option for running this layer, since it tracks visibility, position, and sentiment across AI providers and benchmarks those results against named competitors.
This short walkthrough shows how prompt-level results turn into a prioritized backlog rather than a static report.
Avoid the Measurement Traps
- Inconsistent prompt wording: Small wording changes shift AI answers, so freeze prompt text between measurement cycles.
- Survivorship bias: Analyzing only visible competitors ignores the substitutes buyers choose.
- False attribution: Don't treat correlation between mentions and revenue as proof that mentions caused the revenue.
Pair visibility metrics with commercial discipline. Just as teams use a PH iGaming user acquisition cost guide to tie acquisition spend to payback decisions in that market, you should connect visibility gains to visits and conversions before claiming impact. Pricing deserves the same rigor, so set a routine to track competitor pricing on a fixed cadence instead of checking pages when a deal is lost.
Record your baseline scope and source definitions in the plan appendix. Without that record, your next refresh isn't comparable and your trend line is fiction.
Sizing the Market with Public Data and Honest Ranges
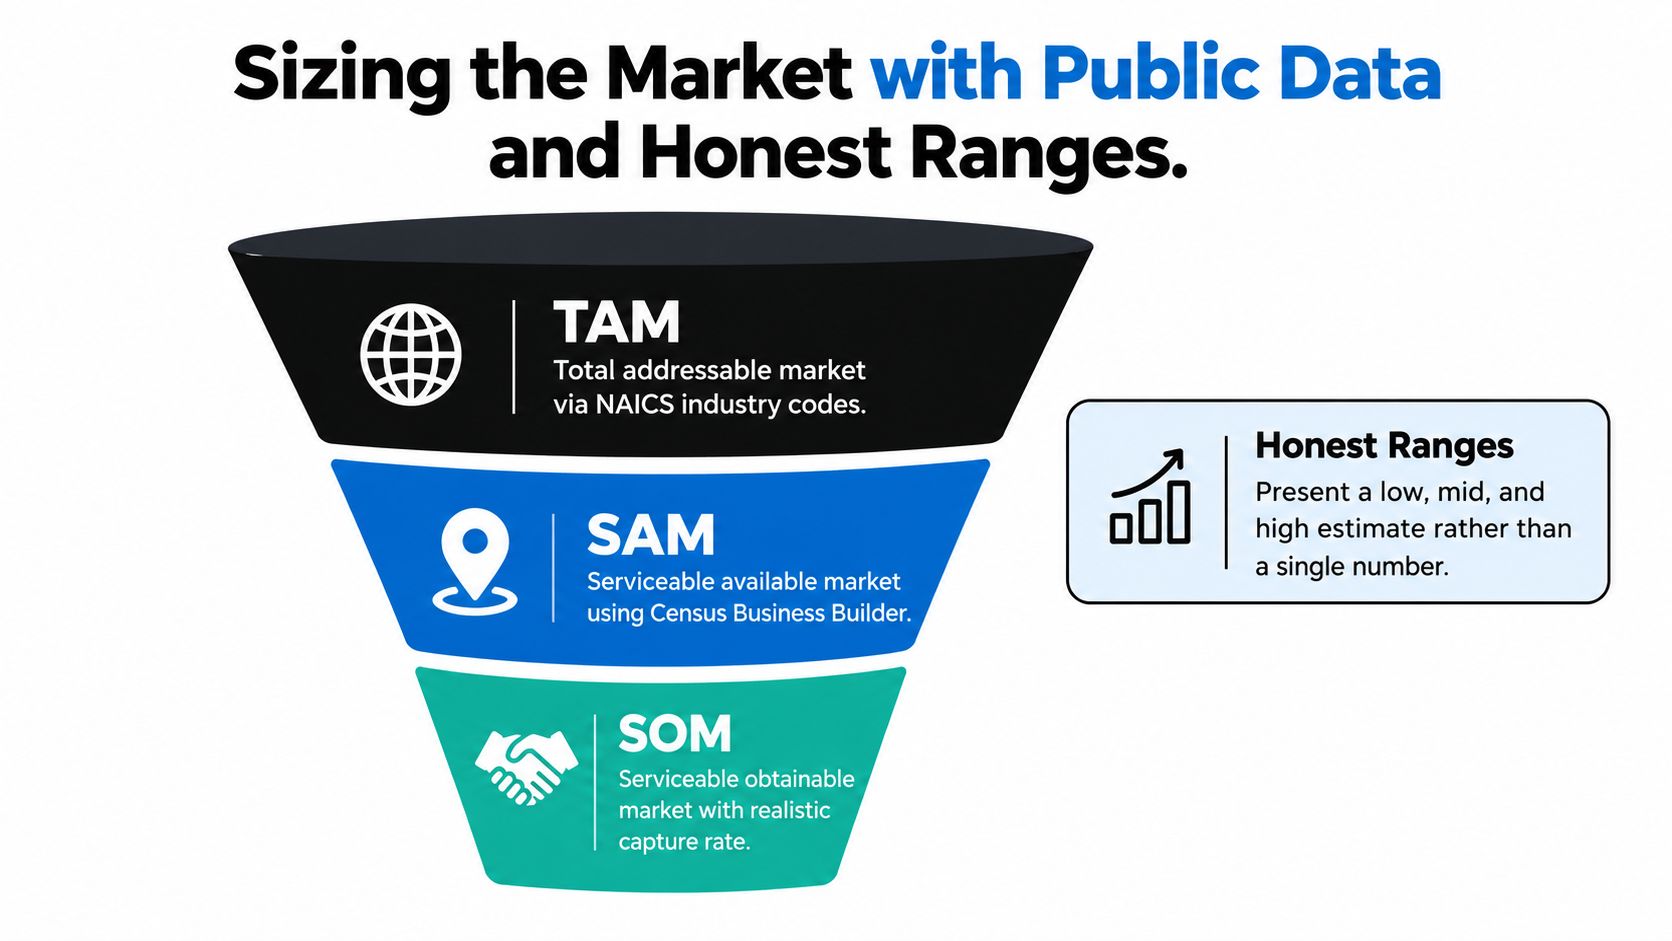
Investors ask the market size question right after the competition question, and a single round number with no source ends the conversation. Build TAM, SAM, and SOM from named public sources, then present a low, mid, and high range for each layer.
The funnel below shows how each layer narrows from total demand to what you can realistically capture.
Build From the SBA Statistical Stack
The SBA points planners toward NAICS and Census Business Builder data for industry structure, Census and Bureau of Labor Statistics data for demographics and employment, the Consumer Price Index and GDP for economic conditions, Federal Reserve data for interest rates, consumer-spending data for demand, and Statistics of U.S. Businesses for industry-specific information. That stack was described in the SBA guidance referenced earlier, so cite the specific dataset and vintage for every figure you lift.
Convert each public number into an explicit assumption. Industry firm counts become your account universe. Employment and income data constrain which segments can pay. Consumer spending and interest rate data shape your adoption timing. If an assumption can't be traced to a dataset, label it as a founder estimate and give it a wider confidence range.
Stress Test Adoption Assumptions
Small-business adoption is a useful reality check for any AI-adjacent plan. The SBA's 2025 research identifies cost, security concerns, regulatory uncertainty, and the belief that AI is not applicable as barriers to adoption, detailed in its 2025 research spotlight on AI in small business. Xero also reported that small-business sales grew only 2.4% year over year in 2025 in that same research context, which makes aggressive capture assumptions harder to defend.
A range with stated assumptions beats a precise number with none. Investors fund founders who know where their estimate could be wrong.
Triangulate your SOM three ways. Use competitor pricing and visible customer counts as a revenue proxy, demand signals from search and prompt volume as a directional check, and your own pipeline or interview data as a bottom-up anchor. When the three methods disagree, show the spread and explain which one you trust least and why.
Turning Findings Into a SWOT and a Risk Register
A SWOT copied from founder intuition is worthless. Every cell must trace back to a specific row in your matrix or a measured metric. If you can't point to the evidence, cut the claim.
Anchor Every SWOT Cell in Evidence
Strengths and weaknesses are internal, opportunities and threats are external, and mixing them up signals sloppy thinking. For a pre-revenue company, strengths and weaknesses are mostly the founding team's skills, network, and constraints. Say so plainly.
Force yourself to name one credible weakness and the substitutes customers use today. That's the part most competitive slides hide, and it's the part investors probe in diligence. A weakness with a mitigation plan raises credibility. A missing weakness lowers it.
Don't infer market position from competitor websites alone. Triangulate structured prompt tests with pricing pages, customer interviews or review coding, traffic and conversion data, and independent market benchmarks, consistent with independent competitive intelligence guidance recommending combined public, observational, and third-party data. Clean the data first by deduplicating prompts, standardizing competitor names and plan definitions, and separating observed facts from analyst judgments.
Convert Findings Into Owned Actions
Each finding ends with four fields. An owner, the expected impact, the implementation cost, and a validation test that could prove the finding wrong. That discipline turns your SWOT into a risk register instead of a poster.
- Risk: A direct rival gets cited more often in buyer-intent AI answers for your priority segment.
- Severity and likelihood: Rate both explicitly and state the evidence behind each rating.
- Mitigation: Name the content, product, or partnership action, plus its owner and cost.
- Trigger: Define the measured change that escalates the response, such as a sustained visibility drop across providers.
Add a separate row for AI discovery risk. A 2025 survey of 2,237 consumers in the United States, United Kingdom, France, and Germany found that 43% used AI search tools such as ChatGPT or Gemini daily, 62% trusted AI to help evaluate brands, and 48% routinely cross-checked answers across multiple platforms, according to reporting on AI as a brand discovery engine. The same survey found 57% still preferred traditional search for personal, medical, or financial research and only 19% trusted AI over traditional search for local decisions, from that same reporting.
That split matters for your register. Discovery risk and conversion risk aren't the same, so benchmark broad discovery, high-risk categories, local intent, and commercial prompts separately. For a deeper method on structuring this work, our guide to competitive intelligence analysis covers how to move from raw observations to decision-ready findings.
Packaging the Section and Setting a Refresh Cadence
Your final section needs four artifacts, nothing more. A one-page competitor matrix. A positioning narrative tied to specific evidence rows. A risk register with triggers. A market-sizing appendix with sources, data vintage, and confidence bands. If a page doesn't support one of those four, cut it.
Make It a Living Measurement System
A competitive analysis that never updates is a liability by the next board meeting. Set a fixed refresh cadence tied to events that actually change the picture, such as a rival's pricing change, a major product launch, a new AI model release, or your own segment expansion. Repeat the same prompts and definitions each cycle so you can distinguish a durable shift from normal sampling variation.
Assign alert thresholds in advance. Decide which measured change in share of voice, sentiment, or answer position triggers a review, who owns that review, and what actions are pre-authorized. A competitive intelligence dashboard keeps those signals visible between formal refreshes, so surprises surface in weeks rather than quarters.
Run the Pre-Submission Checklist
- Sample size and time period: Stated for every benchmark, with the provider mix named.
- Confidence limits: Each major claim labeled as observed fact, triangulated estimate, or founder judgment.
- Falsification test: The exact experiment that could disprove your positioning, written down before you pitch.
- One weakness: Present in your own matrix row, with a mitigation and an owner.
- Decision links: Every finding tied to a pricing, segment, product, or content decision in the plan.
Read the section as a skeptic would. Could someone outside your industry name your main competitors, state what they charge, identify the substitutes, and explain why a specific customer segment would choose you? If not, the problem isn't wording. The fieldwork isn't done yet, and no amount of slide design will fix that in the room.
Stop defending a logo grid and start measuring how AI assistants recommend you against named competitors, prompt by prompt and provider by provider. MyMentions tracks your AI share of voice, answer position, sentiment, and citation sources, then turns the gaps into a prioritized backlog your team can ship before your next investor update.