
Track more prompts, add more competitors, watch share of voice daily. That's the popular advice, and it's how teams build a competitor analysis dashboard that looks precise while reporting noise. I would start from the opposite rule. Treat every number as a claim that has to survive a rerun, a prompt rewrite, and a comparison across providers before anyone changes content, pricing, or positioning because of it.
A useful dashboard doesn't need forty tiles. It needs a fixed competitor set, buyer-intent prompts you don't keep editing, raw answers you can inspect, and a confidence band beside every headline metric. Without those controls, a rival's apparent lead may only mean you sampled one provider on one day with wording that favored them. Build for validation first, then scale the tracking.
Table of Contents
- Metrics Every Competitor Dashboard Should Surface
- How to Set Up Sources, Prompts and Check Budgets
- Checking Whether Competitor Rankings Are Real
- Dashboard Layout That Stakeholders Read in Two Minutes
- Alert Rules and Reports That Lead to Action
- Connecting Competitor Visibility to Traffic and Revenue
- Pilot the Dashboard for Two Weeks Before You Scale
Metrics Every Competitor Dashboard Should Surface
| Metric | What it measures | How to calculate | Trap to avoid |
|---|---|---|---|
| Visibility | Share of tracked answers where your brand appears | Brand answers divided by tracked answers | Shifts when the prompt set changes |
| Average position | Average rank when your brand is recommended | Mean rank across recommending answers only | Silent losses hide in answers with no recommendation |
| Share of voice | Your mentions as a share of all tracked brand mentions | Your mentions divided by all competitor mentions | Meaningless if the competitor list changes |
| Sentiment | How positive responses sound about your product | Scored per answer, averaged per prompt group | Wording changes move the score |
| Confidence | Sample size and run-to-run stability | Repeat runs and show a range, not one value | A single run looks certain; the band only narrows with repeats |
Visibility is the share of tracked answers where your brand appears. If you're named in 30 of 100 tracked answers, you're at 30% visibility for that prompt set, provider mix, and period. The trap is prompt churn. Add ten prompts about a feature you don't offer and visibility falls even though nothing changed in the market, so freeze the set for trend reporting and version any replacement.
Average position is the average rank when your brand is recommended. Compare it only where both brands are recommended in the same answer, otherwise you're averaging different contests. A brand can improve position while losing visibility, because answers where it disappears entirely drop out of the calculation. Always read position next to visibility, never as a standalone win.
Relative and qualitative measures
Share of voice divides your mentions by all mentions across the tracked competitor set. It answers who dominates the conversation you chose to measure, which is why the competitor list has to stay fixed. Swap in a weaker rival and your share rises without a single new mention. If you're evaluating tools to build that fixed set, you can find competitor research software through Grou and compare options against the buyer decision you're tracking.
Sentiment measures how positive AI responses sound around your product. Score it per answer, then average it per prompt group rather than across the whole dashboard. Pricing prompts naturally attract caveats about cost, while ease-of-use prompts attract praise, so a blended score hides the useful signal. A sentiment drop inside one group tells you where the description changed. A small drift everywhere often tells you the scoring wording drifted.
Confidence is the metric that disciplines the other four. Show the sample size behind each tile, the date of the last run, and the range across repeat runs. If visibility moves two points inside a five-point band, that's measurement noise, not momentum. Our guide to competitor benchmarking methods and cadence covers how to set those comparison rules before you report movement to stakeholders.
Reading rule: Any movement smaller than the confidence band is noise, not a win, a loss, or a reason to brief leadership.
I would keep these five on the front panel and push everything else to drill-down views. Citation domains, prompt-level wins and losses, and provider splits matter for diagnosis, but they don't belong beside the headline numbers. The front panel should let a founder answer three questions fast. Are we appearing, where are we ranking when we appear, and is the change real enough to act on?
How to Set Up Sources, Prompts and Check Budgets
The diagram below shows the setup order I would follow before running a single live check.
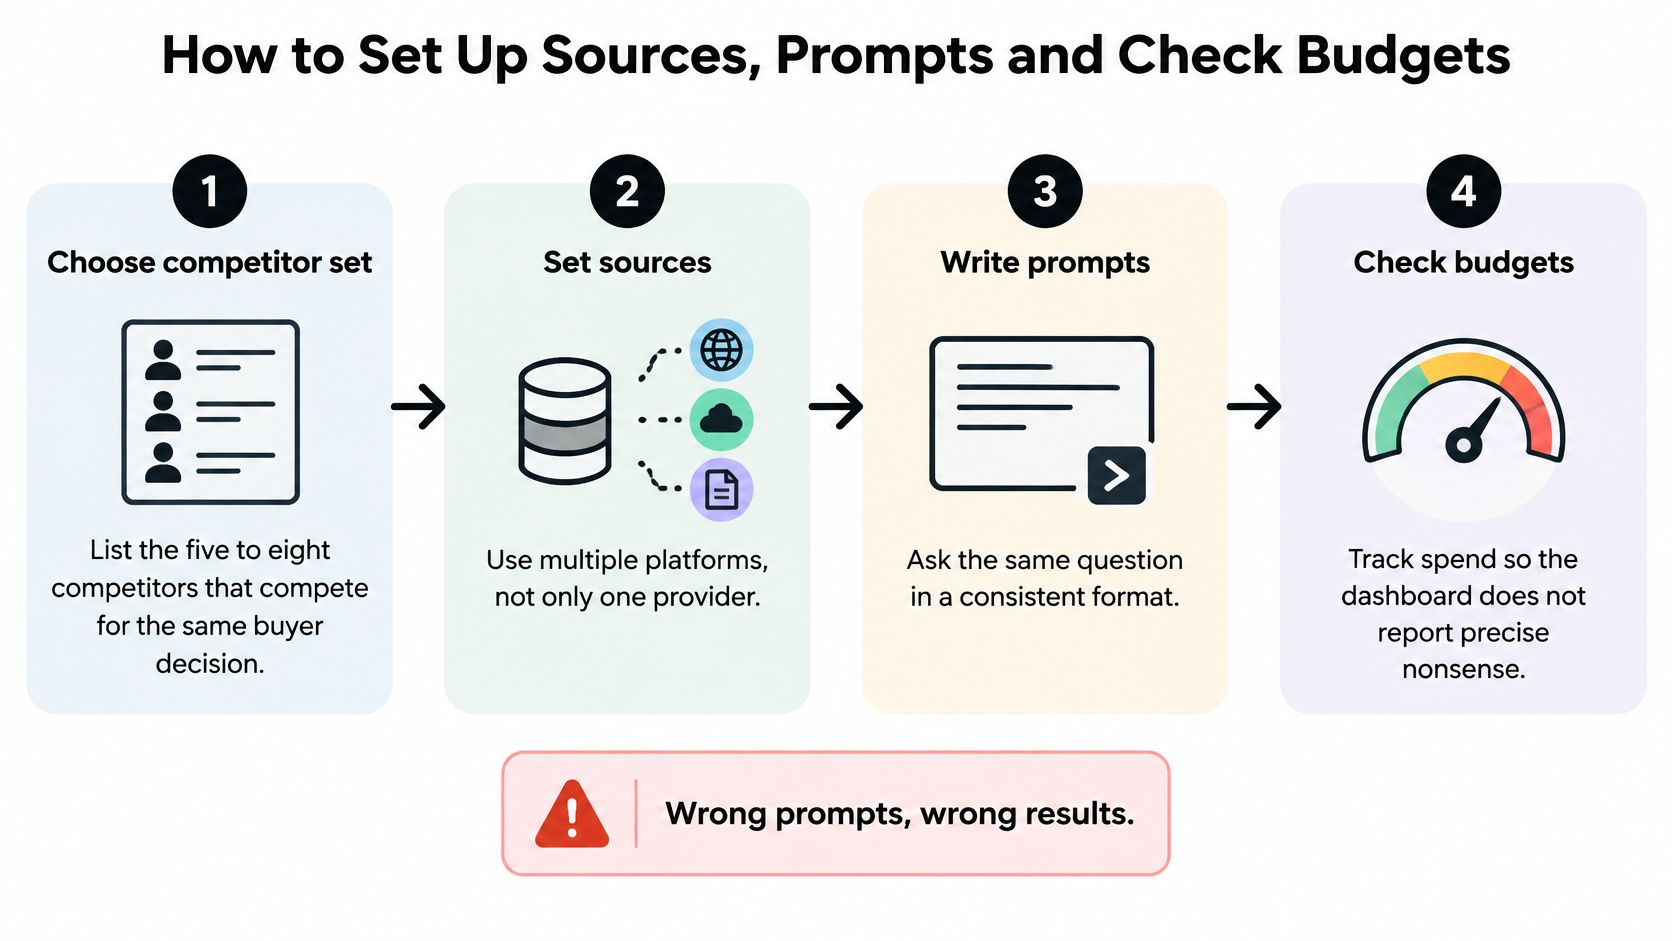
- List five to eight competitors for the same buyer decision. Include the spreadsheet workaround or the incumbent suite if buyers choose them instead of you. Keyword overlap alone produces a tidy list that misses the alternative your sales team loses to.
- Write 20 to 40 buyer-intent prompts in prospect language. Split them into branded and unbranded groups, and tag each one by job, such as shortlisting, pricing, migration, or integration. "Best invoicing tool for a two-person agency" will teach you more than "invoicing software features."
- Choose providers where your buyers ask questions. A team selling to developers may weight Claude and Perplexity more heavily than a consumer brand would. Don't spread checks evenly out of habit if your audience clearly favors two or three assistants.
- Budget checks before you run anything. One provider check runs one prompt against one provider, so 5 prompts across 3 providers use 15 daily checks. Checking 1 prompt across 8 providers uses 8 provider checks from the daily plan limit. Do this math on paper first, because prompt lists grow faster than budgets.
- Fix the schedule and hold prompts steady for at least a month. Daily runs suit fast-moving categories, but comparability matters more than frequency. If you rewrite prompts every week, you're restarting the trend line every week.
- Store raw answer text, cited URLs, and a timestamp for every run. You'll need the exact wording when a stakeholder asks why sentiment fell or why a rival suddenly ranked first. Aggregates without the underlying answers can't be audited.
Pre-launch checks
Run one prompt twice on the same day before you trust the dashboard. If the brand order flips between those two runs, your confidence band needs to reflect that instability from day one. That small test often saves a month of arguing about movements that were never real.
For teams building the wider workflow around this setup, the AI visibility resources for software agencies from 100Signals are a useful companion when you're deciding which client questions deserve prompt coverage. Pair that with a structured AI search visibility audit process so your prompt groups map to pages and claims you can improve. Setup isn't finished when the first chart renders. It's finished when you can explain what each prompt represents, what each check costs, and how you'll prove a change is real.
Checking Whether Competitor Rankings Are Real
The image below captures the moment most dashboards fail, when a clean ranking invites action before anyone asks how stable it is.
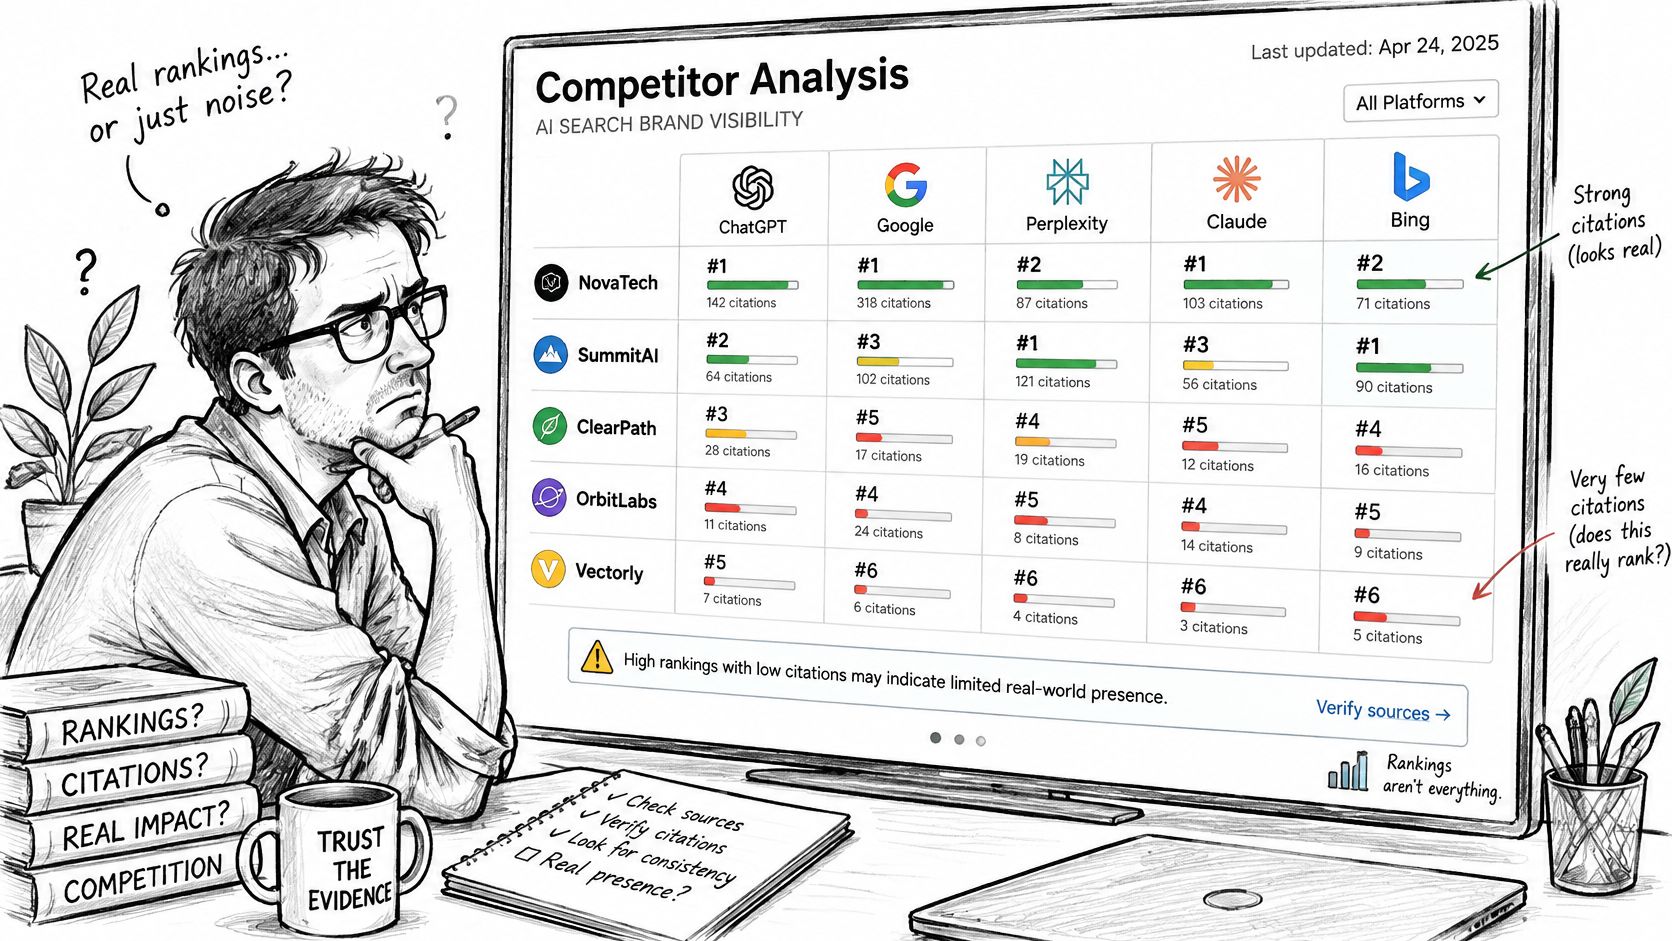
A 2026 scoping review of 38 empirical studies found that the same brands could be cited anywhere from 16% to 91% depending on the platform. That spread should change how you read every competitor ranking. A single provider can flatter one brand and punish another because of its retrieval sources, model behavior, geography, or the exact prompt wording you chose.
Three validity checks
- Repeat the run. Rerun each prompt at least three times on different days and report the range, not one value. A lead that appears once and vanishes twice belongs in a watch list, not a strategy deck.
- Separate branded from unbranded prompts. Putting a brand name in the prompt inflates that brand's visibility, so never blend "Is Brand X good for agencies?" with "What's the best tool for agencies?" The first measures reputation on demand. The second measures discovery.
- Report engine disagreement instead of averaging it away. If OpenAI ranks you first and Perplexity ranks your rival first for the same prompt, show both results and inspect the cited sources. The disagreement often points to a content gap on one surface, such as weak documentation or missing review coverage.
The short video below is worth watching with those three checks in mind, especially where rankings get presented as settled facts.
Name the coverage gaps on the dashboard itself. Our provider checks are provider API checks. They don't reproduce every consumer app experience, and they don't track Google AI Overviews, Google AI Mode, or Microsoft Copilot. A visibility score describes the responses collected for the selected prompts, providers, and reporting period, not every AI search a buyer might run.
I would label any competitor figure based on fewer than about 30 answers per period as directional. Before acting on an apparent lead, ask three questions. Did it persist across reruns, does it hold across providers, and does it survive a plain-language rewrite of the prompt? If the answer to any one is no, collect more evidence first.
Dashboard Layout That Stakeholders Read in Two Minutes
The layout sketch below shows the top-to-bottom reading order that keeps a competitor analysis dashboard scannable.
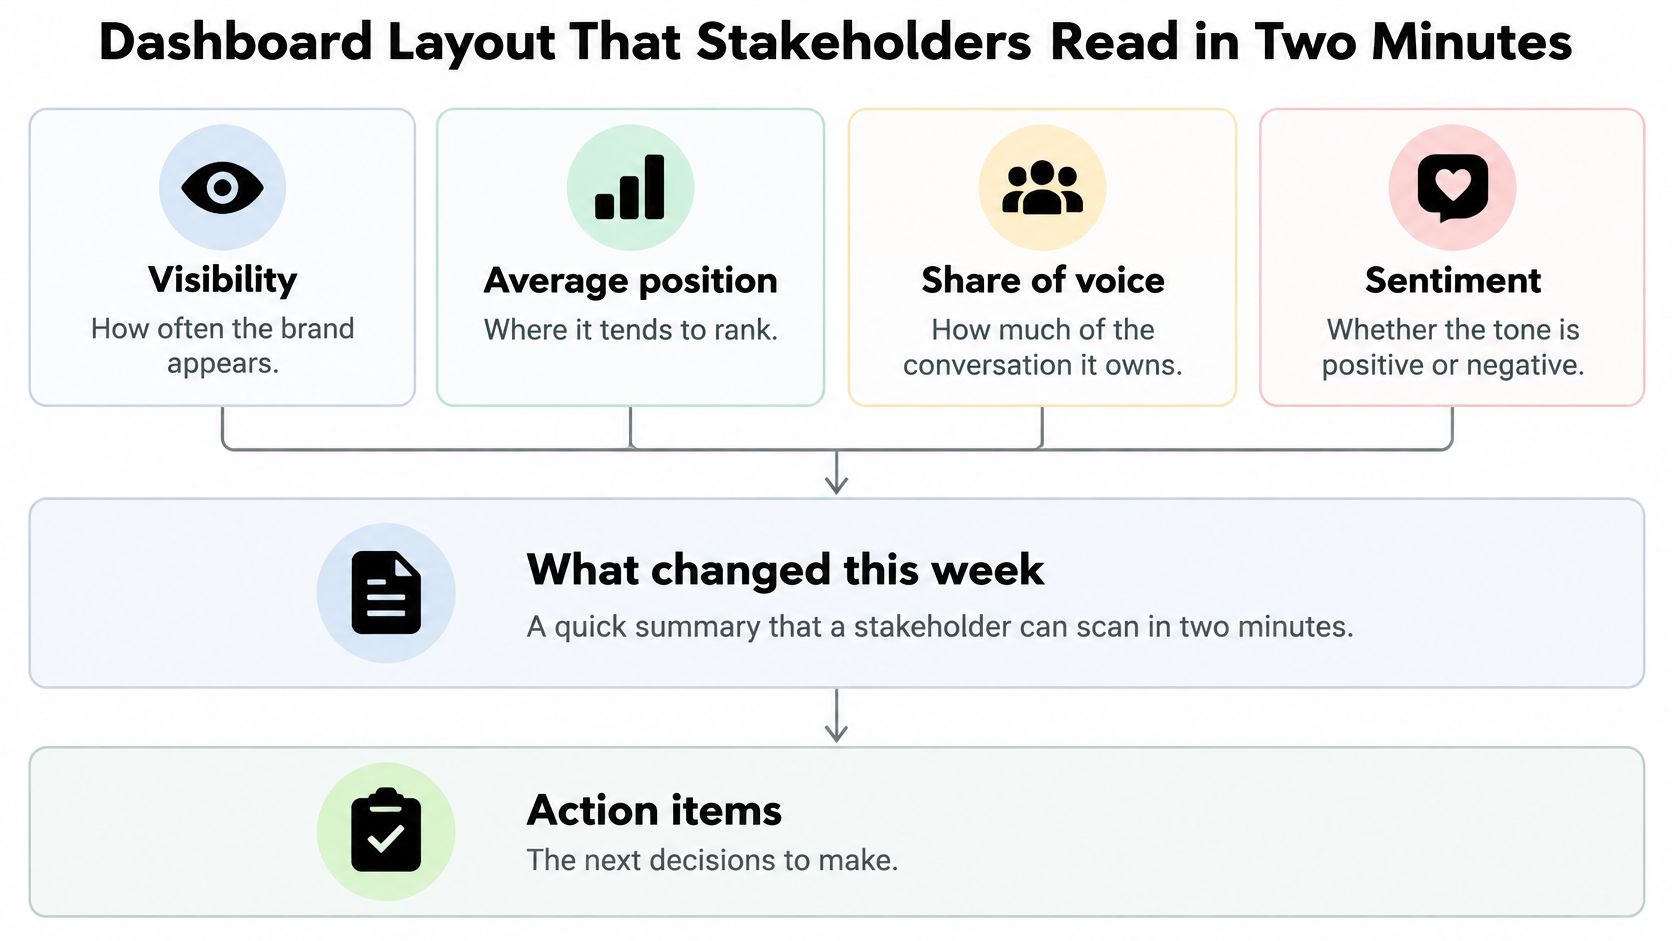
Start with four tiles across the top row for visibility, average position, share of voice, and sentiment. Show each one against your named competitors, with the change since the last period and the sample size behind it. Customers can add competitor brands and compare share of voice and sentiment against them, so the top row should make that head-to-head reading instant. If a tile needs a paragraph of explanation, it doesn't belong in row one.
Below the tiles, place a competitor grid with one row per brand. Show prompt wins, losses, and ties so readers can see who owns which buyer question instead of arguing about blended averages. A rival may lead overall while losing every pricing prompt, and that pattern leads to a very different response.
Panels that support the headline numbers
Next comes a trend chart with confidence bands. This panel stops a single bad week from triggering a rushed content rewrite or a positioning change. Under it, a prompt table lets analysts open the raw answers behind any number, including cited URLs. Then add a citation panel listing the domains AI answers cite for each competitor, such as review sites, documentation, comparison pages, and help content. Finish with an alert feed showing the last five triggered alerts and who owns each one.
Each panel gets one question. The tiles ask where you stand, the grid asks who owns each prompt, the trend asks whether movement is real, and the citation panel asks what evidence the models trust. For location-based teams adapting this structure, Digital Skyrocket's view on reporting qualified leads across service locations is a helpful reminder that stakeholder dashboards still need a clear business outcome at the bottom. Our collection of reports and dashboard layout examples shows how that hierarchy works in practice.
Apply a simple layout test before you ship it. Can a busy founder explain the top row in one sentence, and can they read the trend chart without asking which confidence band applies? If not, remove panels before you add explanations.
Alert Rules and Reports That Lead to Action
| Alert | Trigger | Owner |
|---|---|---|
| Visibility drop | Visibility falls past the confidence band in two consecutive runs | SEO lead |
| Competitor gain | A named rival takes a recommended position on a high-intent prompt | Product marketing |
| Sentiment shift | Average sentiment falls across a prompt group | Brand manager |
| Citation change | A new third-party domain enters the top cited sources | Content strategist |
An alert only helps if it has a trigger, a threshold, and an owner. The visibility drop rule waits for two consecutive runs outside the confidence band because one bad run is exactly the noise problem you're trying to escape. A competitor gain matters most on high-intent prompts, where a buyer is shortlisting or comparing prices, so product marketing should receive that one with the raw answer attached.
Route alerts to Slack, Discord, or email where the owner already works. Set thresholds above the variance you measured during setup, or the team will mute the channel within a week. I'd rather miss a tiny early wobble than train everyone to ignore the alerts that signal a real shift. Our guide on tracking brand mentions in AI search goes deeper on the monitoring habits behind these rules.
Reporting cadence
Send a weekly digest with three numbers and one proposed action. Keep it short enough that a lead can approve, reject, or reassign the action in the thread. The monthly stakeholder report carries more weight, with the trend, a clear verdict on whether competitor movement is real, and two decisions for leadership. Export that monthly report as a PDF when a leadership review needs a fixed record that won't change after the meeting.
A number without a decision attached is only decoration.
Write the action into the alert template itself. "Visibility fell on migration prompts, SEO lead to check the cited help pages by Friday" beats "visibility down" every time. Review muted or ignored alerts monthly and delete rules nobody acts on. A short list of trusted alerts will outperform a clever matrix of fifteen triggers that fire daily and change nothing.
Connecting Competitor Visibility to Traffic and Revenue
The funnel below separates being mentioned from being chosen, which is where many competitor dashboards overclaim.
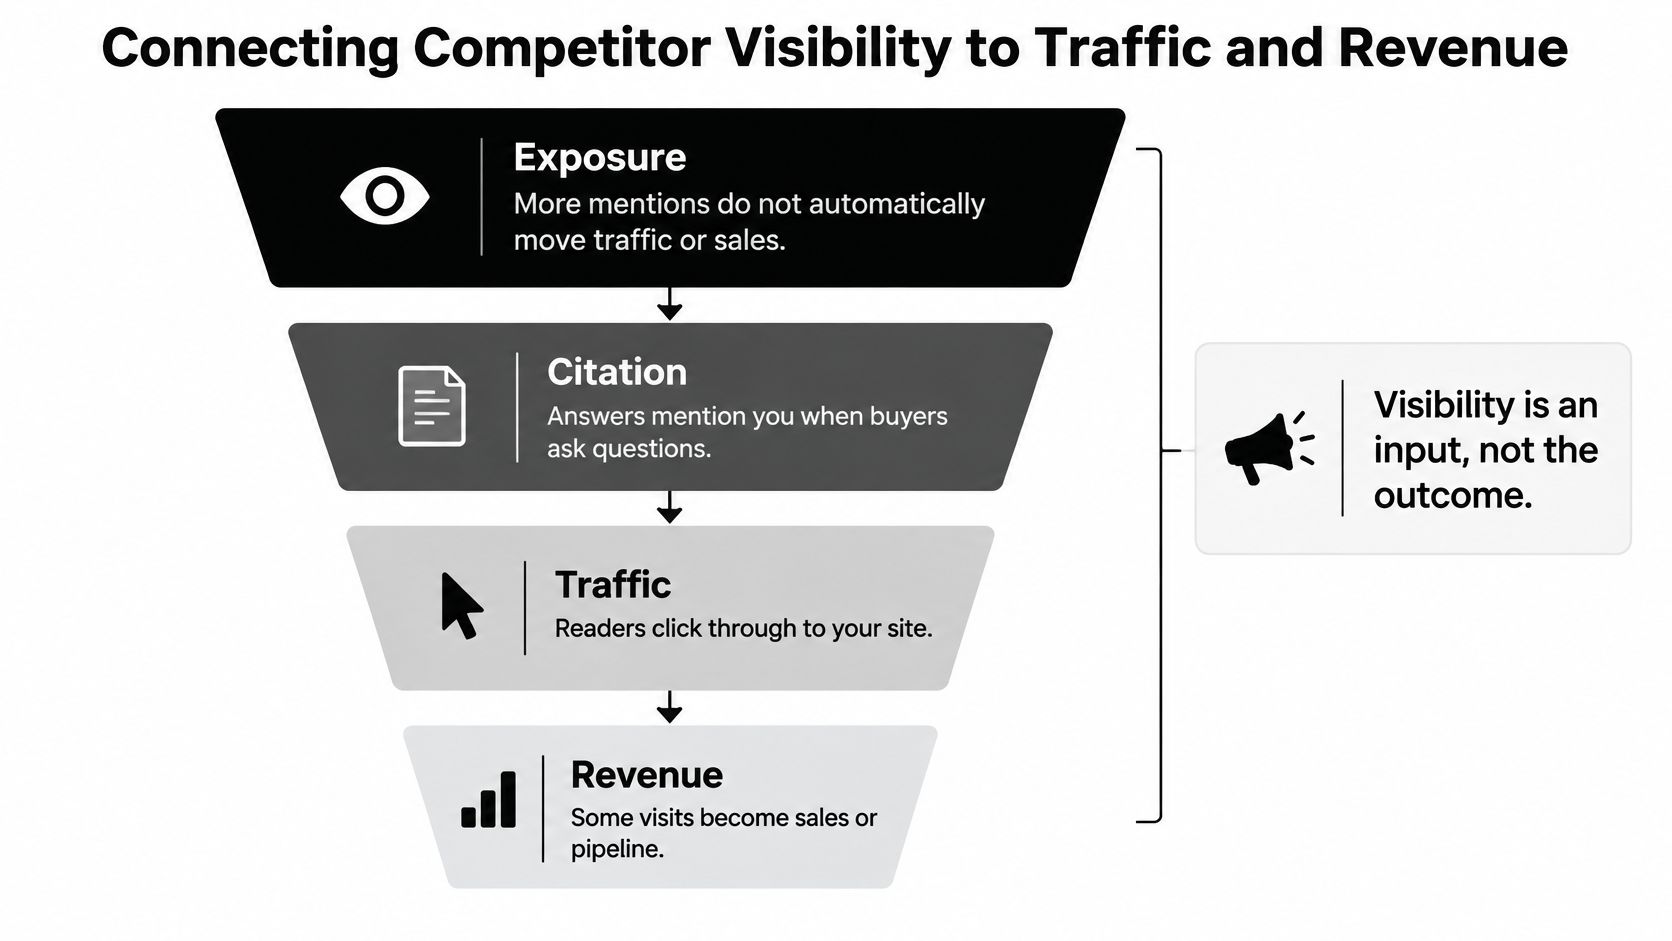
Walk the funnel in stages and name the source system for each row. Exposure counts answers that mention you. Citation counts answers that link your URL. Visit pulls referral sessions from detectable AI sources, while signup, trial, and revenue come from your analytics or billing system. An AI traffic visit is separate from a mention, signup, or purchase, and completed conversions must be measured in your own analytics or billing system, as our guide to AI traffic analytics and attribution explains.
That separation matters because the evidence cuts both ways. The Search Engine Land analysis of AI search as a branding channel describes a test of 632 sites that found no reliable link between AI visibility and subsequent branded search or direct traffic. The same piece reports separate consumer research where 62% of U.S. consumers had bought a different brand because of an AI chatbot and 71% said AI meaningfully affected brand consideration at least half the time. Visibility can influence buyers, but you can't assume every mention does.
Say a competitor gains position on a pricing prompt while your AI referral traffic stays flat and signups don't move. That lead is visible but not yet persuasive, so you'd monitor it rather than rewriting your pricing page that week. Missing referrers, blocked scripts, and source classification can also affect AI traffic tracking coverage, which means flat traffic should be checked against tracking quality before you declare no impact.
Add a trust row to the funnel. Track whether reviews, social platforms, and independent publishers support or contradict what AI answers say about each competitor. Consumer research in that analysis also reported the share finding AI search more helpful than traditional search falling from 82% in 2025 to 54% in 2026. I would treat a competitor lead as commercially serious only when visibility, credible citations, and downstream visits or trials move together.
Pilot the Dashboard for Two Weeks Before You Scale
Pilot before you build the full dashboard. A two-week pilot tells you whether your prompts, providers, and thresholds produce numbers you'd act on, and it does that before you've burned budget on broad coverage nobody trusts.
- Pick one product line and three competitors. Narrow scope makes every disagreement between runs easier to investigate.
- Run about 20 prompts daily for two weeks. Use your setup list across your chosen providers and resist editing prompts mid-pilot, even when a wording flaw annoys you. Note the flaw, fix it in version two.
- Check stability against your validity ranges. Confirm reruns fall inside expected bands and that top-row numbers survive a prompt rewrite. If they don't, your measurement needs work before your content does.
- Choose two metrics that drive a weekly decision. Assign an owner to each alert from the alert table and delete any metric nobody would act on.
- Scale only after the pilot produces an actionable number. Add providers and competitors once the core view has changed at least one real decision.
Keep the pilot log of raw answers, cited URLs, and timestamps so every later change can be traced to evidence. To get started, create a product, choose a plan, and then see how AI assistants mention, rank, and describe your brand. You can start on the Starter plan and upgrade later when you need more daily provider checks, 8-provider coverage, recommendations, integrations, or team seats. Compare your pilot figures with the first live run before you widen the scope.
Start your pilot with MyMentions to track visibility, position, sentiment, share of voice, and citation sources for your brand and competitors across supported AI providers in one workspace. You'll see which buyer prompts you win, where rivals take recommended positions, and whether AI mentions turn into visits you can verify.