AI Visibility Metrics: Formulas and Benchmarks
Look up ai visibility metrics with formulas, benchmarks, and how to read share of voice, rank, sentiment, and citations in 2026.

In 2025, 36% of generative-AI users surveyed by Adobe said they had replaced traditional search with AI assistants, while 18% used generative AI for personalized product recommendations. For a SaaS company, that makes an assistant's answer a place where buyers may evaluate the product before opening its website. But measuring that exposure requires more discipline than counting brand names.
Table of Contents
- What AI Visibility Metrics Actually Measure
- Metric Catalog with Formulas and Readings
- Exposure Quality and Outcome Categories
- Lock the Prompt Panel Before Any Comparison
- Share of Voice Rank and Prompt Visibility
- Sentiment Confidence and Citation Quality
- Why Scores Differ Across AI Platforms
- How Metrics Point to the Next Action
What AI Visibility Metrics Actually Measure
AI visibility metrics are rates, ranks, or quality judgments calculated from a declared set of generated answers. They describe what happened for particular prompts, providers, locales, and collection dates. They aren't a property of your brand across the whole internet.
The distinction changes the question an analyst asks. Instead of asking whether visibility improved, ask whether the brand appeared more often on the same buyer questions, under comparable collection conditions, with enough repeated observations to support the comparison.
Define the construct before the score
A useful catalog contains eight entries: visibility rate, share of voice, average rank, sentiment, confidence, citation share, citation quality, and prompt-level visibility. Referral visits belong beside those measurements as a separate outcome, not inside the definition of visibility.
These entries describe different things. Visibility rate measures inclusion. Rank measures placement conditional on recommendation. Citation quality measures whether the evidence supports the generated statement.
Say an assistant frequently names your invoicing product, places it third in a recommendation list, adds a pricing caveat, and links to an unavailable page. That answer raises distinct questions:
- Inclusion: Did the assistant consider the product relevant enough to name?
- Placement: Which alternatives did it recommend ahead of yours?
- Description: Was the pricing caveat accurate and material?
- Evidence: Could a buyer verify the recommendation through the cited page?
Combining those judgments into a single score makes the corrective action harder to identify. A content team might improve discoverability when the actual problem is an inaccurate pricing description.
Treat the answer as an observation
The governing rule is that a reported figure estimates a distribution of possible answers. A generated response is an observation, not a definitive visibility score. Save it, classify it, and compare it with other responses collected under the same conditions.
Before comparing periods: Export your current prompt list, including its wording and category assignments. A changed question set can produce a changed score without any change in the brand's underlying performance.
Keep the metric definitions close to the dashboard. The practical standard isn't whether a number looks impressive, but whether another analyst could reproduce its denominator, inspect its answers, and understand which decision the result supports.
Metric Catalog with Formulas and Readings
| Metric | What it measures | Formula or unit | How to read a change |
|---|---|---|---|
| Visibility rate | Share of eligible answers that name the brand | Brand-mention answers / eligible answers | A rise means more inclusion, not a better rank |
| Share of voice | Brand mentions versus all tracked entity mentions | Brand mentions / all tracked entity mentions | Can fall when competitors are named more often even if you stay present |
| Average rank | Mean position when the brand is recommended | Sum of recommendation ranks / ranked recommendations | Lower is better; don't assign invented ranks to absences |
| Sentiment | Polarity of the product description | Positive, neutral, and negative split, or positive share minus negative share | High visibility with negative sentiment warrants a description audit |
| Confidence | Uncertainty around the estimate | Interval calculated using sample size and repeated runs | Small movements may be inconclusive |
| Citation share | Answers citing the brand domain among source-citing answers | Answers citing brand domain / answers citing any source | Distinguishes linked evidence from an unlinked mention |
| Citation quality | Whether cited evidence supports the claim | URL correctness, accessibility, freshness, topical fit, and entailment | Citation presence can improve while validity deteriorates |
| Prompt-level visibility | Performance on an individual prompt | Per-prompt visibility, rank, and sentiment | Reveals buying-query losses hidden by category averages |
Read the denominator before the percentage
Consider a hypothetical sample of 100 eligible answers. The brand appears in 40 answers, with a single counted brand mention in each. Across the sample, the extraction process records 160 tracked entity mentions.
The calculations are:
- Visibility rate: 40 / 100 = 40%.
- Share of voice: 40 / 160 = 25%.
- Average rank illustration: Recommendation positions of 1, 2, 3, and 4 average 2.5.
Those rank positions illustrate the calculation, not the complete ranking record for the hypothetical sample. The production denominator must include every answer with an eligible ranked recommendation, while unranked mentions remain separately identifiable.
A visibility increase means the assistant included the brand in more answers. It doesn't establish that the assistant placed it higher. Share of voice answers a different question: how much of the tracked competitive conversation belonged to the brand?
Define what counts as an entity mention before extracting it. Counting repeated occurrences of a name produces a different denominator from counting each brand once per answer. Either convention can support an internal time series, but switching conventions breaks comparability.
Separate description, evidence, and uncertainty
Sentiment measures how positive the response sounds around the product. Score the product-specific passage rather than the entire answer, and preserve mixed descriptions instead of forcing every caveat into a negative category.
For citation share, count source-citing answers, not individual links, in the denominator used here. An answer with several brand-domain links still counts as a source-citing answer containing the brand domain. Label this definition explicitly because another dashboard may use citation occurrences instead.
Confidence isn't the assistant's apparent certainty. It describes uncertainty in your measurement. An interval around a rate helps prevent overreaction, but overlapping intervals alone don't prove that a change is noise; evaluate the period-to-period difference using the sampling design.
Keep this catalog as the glossary for reporting. A formula is useful only when its eligible answers, extraction rules, and treatment of missing values are visible.
Exposure Quality and Outcome Categories
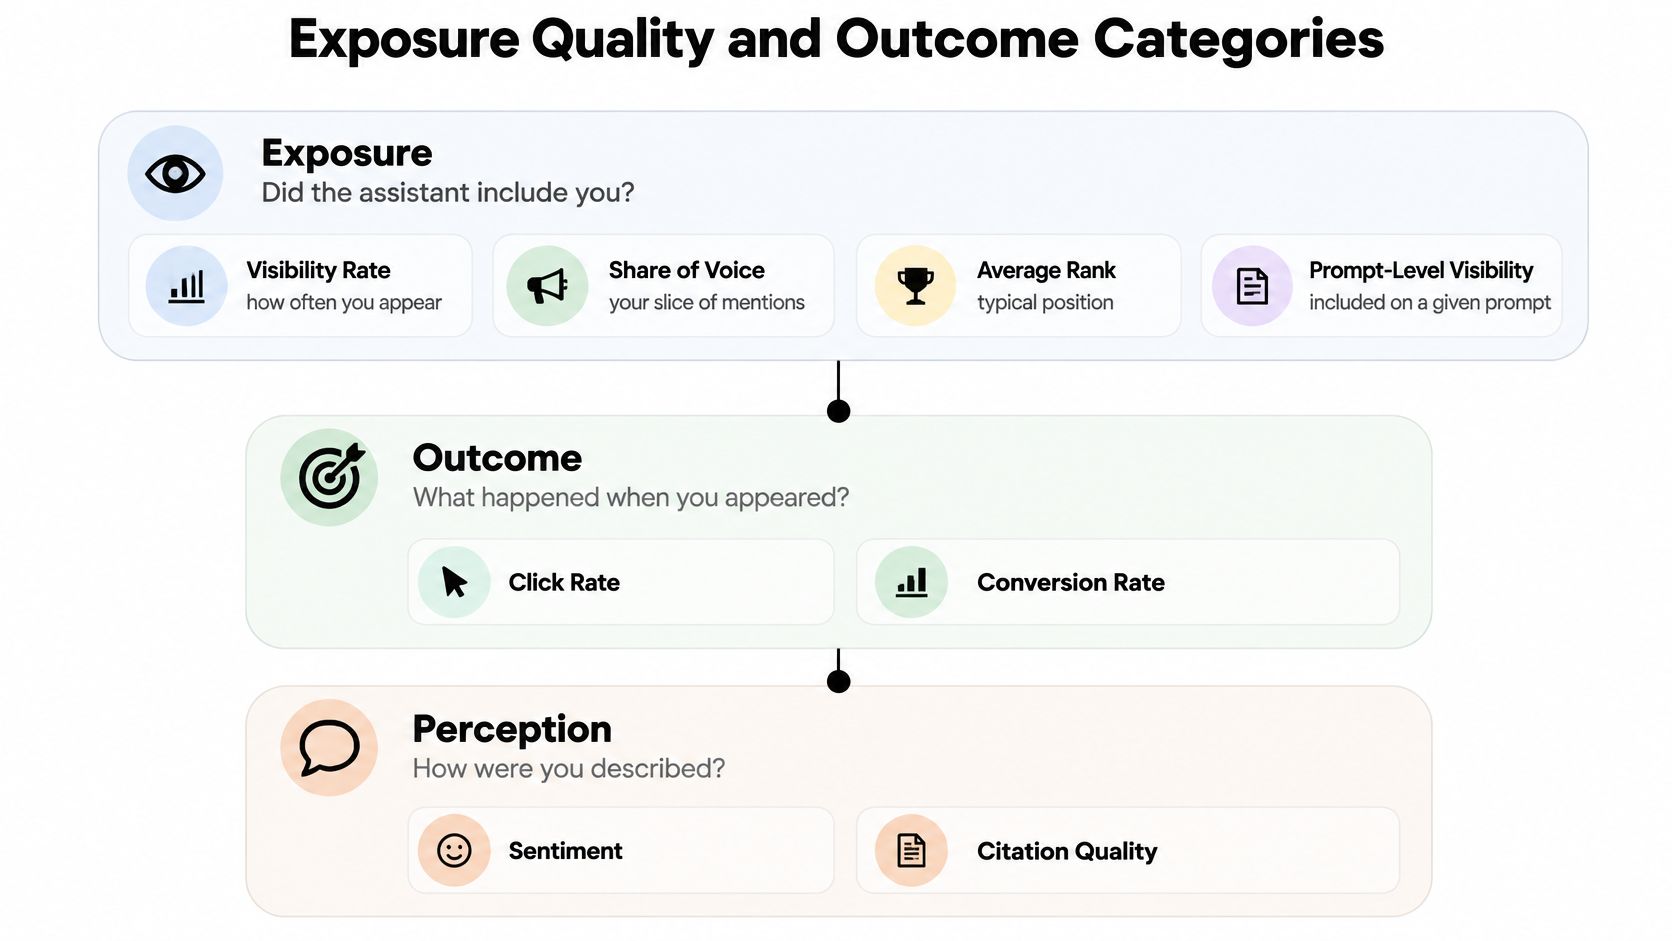
Organize measurement around exposure, quality, and outcomes. Each family answers a different business question, so each should remain inspectable even if leadership also requests a summary score.
Ask a different question of each family
Exposure asks whether the assistant included the brand and where it placed it. Use visibility rate, share of voice, average rank, and prompt-level visibility.
Quality asks whether the description was fair and supported. Sentiment, citation share, and citation quality belong here. Confidence accompanies these measurements as an uncertainty check, rather than acting as another measure of favorable exposure.
Outcomes ask what happened after exposure. Track observable citation clicks, visits classified as AI referrals, and assisted conversions where your analytics can support them.
Consider a brand that leads competitive mention share but is described with an incorrect security capability and produces few detectable visits. A blended score could conceal the unsupported claim behind strong exposure. Keeping the families separate identifies both a factual correction task and an attribution question, without assuming that one caused the other.
Make every observation auditable
The NIST AI Risk Management Framework measurement playbook recommends documenting test sets, metrics, tools, and evaluation methodology, including validity and the conditions under which findings apply. Apply that discipline by recording the measurement unit before calculating rates.
- Identity: Full prompt text, model or provider, locale, interface, timestamp, and answer version.
- Evidence: Complete response text and the cited source URLs.
- Interpretation: Extraction rules, reviewer decision, and any unresolved classification issue.
- Reporting context: Panel name, collection window, sample size, and uncertainty method.
Maintain a fixed benchmark panel of buyer-intent prompts and a smaller rotating discovery panel. Stratify results by provider, market, language, and intent rather than assuming those conditions are interchangeable.
A visibility score describes the collected responses for the selected prompts, providers, and reporting period, not every AI search. Put that scope directly on charts, especially when reports leave the analytics team.
If your dashboard contains only mentions and ranks, it lacks quality and outcome checks. If it contains only referral sessions, it cannot tell you whether buyers encountered the product without clicking. Identify the missing family before adding another composite score.
Lock the Prompt Panel Before Any Comparison
A comparison needs a stable test set. Write buyer questions that reflect actual evaluation tasks, then resist changing their wording whenever the brand performs poorly.
Use sales-call questions, product-selection criteria, and support language to build the panel. Keep brand-seeking questions separate from unbranded discovery questions, since asking directly about your product tests a different capability from asking an assistant to select a vendor.
Set up a reproducible collection process
- Freeze the benchmark wording. Include comparison, selection, and troubleshooting intents. Assign each prompt a persistent identifier and preserve its original text.
- Declare collection conditions. Record provider, locale, interface, search mode where available, and account context. A changed collection condition needs a visible annotation.
- Schedule repeated runs. Use a consistent cadence that fits the decision you need to make. Collect enough repetitions to inspect variability rather than treating a convenient schedule as proof of reliability.
- Preserve the evidence. Save the answer, cited URLs, extraction output, and reviewer decision together. Don't keep only the summary score.
- Publish denominators and uncertainty. Report eligible-answer counts beside rates, and leave inconclusive changes unflagged rather than manufacturing an alert.
A prompt regression testing workflow helps distinguish a deliberately changed test from a changed result. When wording must change, create a new prompt version instead of overwriting the historical record.
Keep discovery separate from benchmarking
Use the rotating discovery panel to investigate emerging buyer language or newly relevant capabilities. Promote a discovery prompt into the benchmark only through a documented panel revision.
Don't add difficult prompts to the current period and compare its aggregate directly with an easier historical panel. Either rerun both periods under a comparable design where possible, or label the new series as a new baseline.
For collection planning, one prompt against one provider is one provider check. Five prompts across three providers therefore use 15 checks. That arithmetic describes collection workload, not statistical adequacy.
Store mentions, ranks, sentiment, competitors, and citations against the same prompt identifiers. Link referral reporting through available provider, page, and time dimensions, but don't imply that a website visit can always be traced to a particular sampled prompt.
A benchmark panel should change because the buying question changed, not because the answer disappointed the team.
Share of Voice Rank and Prompt Visibility
Consider a hypothetical buyer panel containing 20 prompts, each run once against three providers. That produces 60 answers. The brand appears in 24 of them, so its observed visibility rate is 24 / 60 = 40%.
Suppose those answers contribute 24 counted brand mentions, while competitors contribute another 48 entity mentions. The brand's share of voice is 24 / 72 = 33.3%. This is a worked example, not a market benchmark.
Inclusion isn't placement
Now suppose the ranked recommendations include 14 appearances in second place and 10 in third place. The average rank is:
((14 × 2) + (10 × 3)) / 24 = 2.42, or approximately 2.4.
Coding the remaining 36 absent answers as rank 10 would produce (58 + 360) / 60 = 6.97. That invented average combines inclusion and placement into a quantity with no clear interpretation. The absence already belongs in visibility rate.
Keep a separate status for mentions that aren't ranked recommendations. An assistant may name the product in an explanatory paragraph without assigning it an ordinal position. Don't infer a recommendation rank from the order of incidental text unless that is explicitly your defined metric.
A share-of-voice calculator is useful only after the entity-counting rule is settled. Decide whether aliases merge into a single brand and whether repeated names count again.
Inspect the buyer questions the average hides
Within the same hypothetical panel, consider these results:
| Buyer prompt | Provider inclusion | Operational interpretation |
|---|---|---|
| Best billing tool for agencies | Present on one of three providers | Inspect agency-specific comparisons and cited alternatives |
| SOC 2 compliant invoicing software | Present on all three providers | Verify the compliance description and its supporting evidence |
These are sparse observations, not stable prompt-level estimates. Still, they identify where to collect more evidence. The panel average can't tell a product marketer whether the agency use case or the compliance use case needs attention.
Apply consistent rules to edge cases:
- Tied recommendations: Assign tied leaders the same rank if that's the declared convention, and preserve the tie in the record.
- Caveat-only mentions: Count a genuine brand mention toward visibility, then score the caveat separately for sentiment and factual accuracy.
- Changed competitor sets: Recalculate the share-of-voice denominator when tracked entities change. Don't interpret a taxonomy change as a competitive loss.
Adding competitors can reduce measured share of voice without removing any brand appearances. Where possible, preserve both a stable competitor-panel series and an expanded discovery view.
Prioritize prompts by the gap against the category leader, then inspect the underlying answers. Work on the largest commercially relevant gaps before rewriting pages for intents the brand already wins. The appropriate unit of intervention is often a buying question and its supporting sources, not the whole website.
Sentiment Confidence and Citation Quality
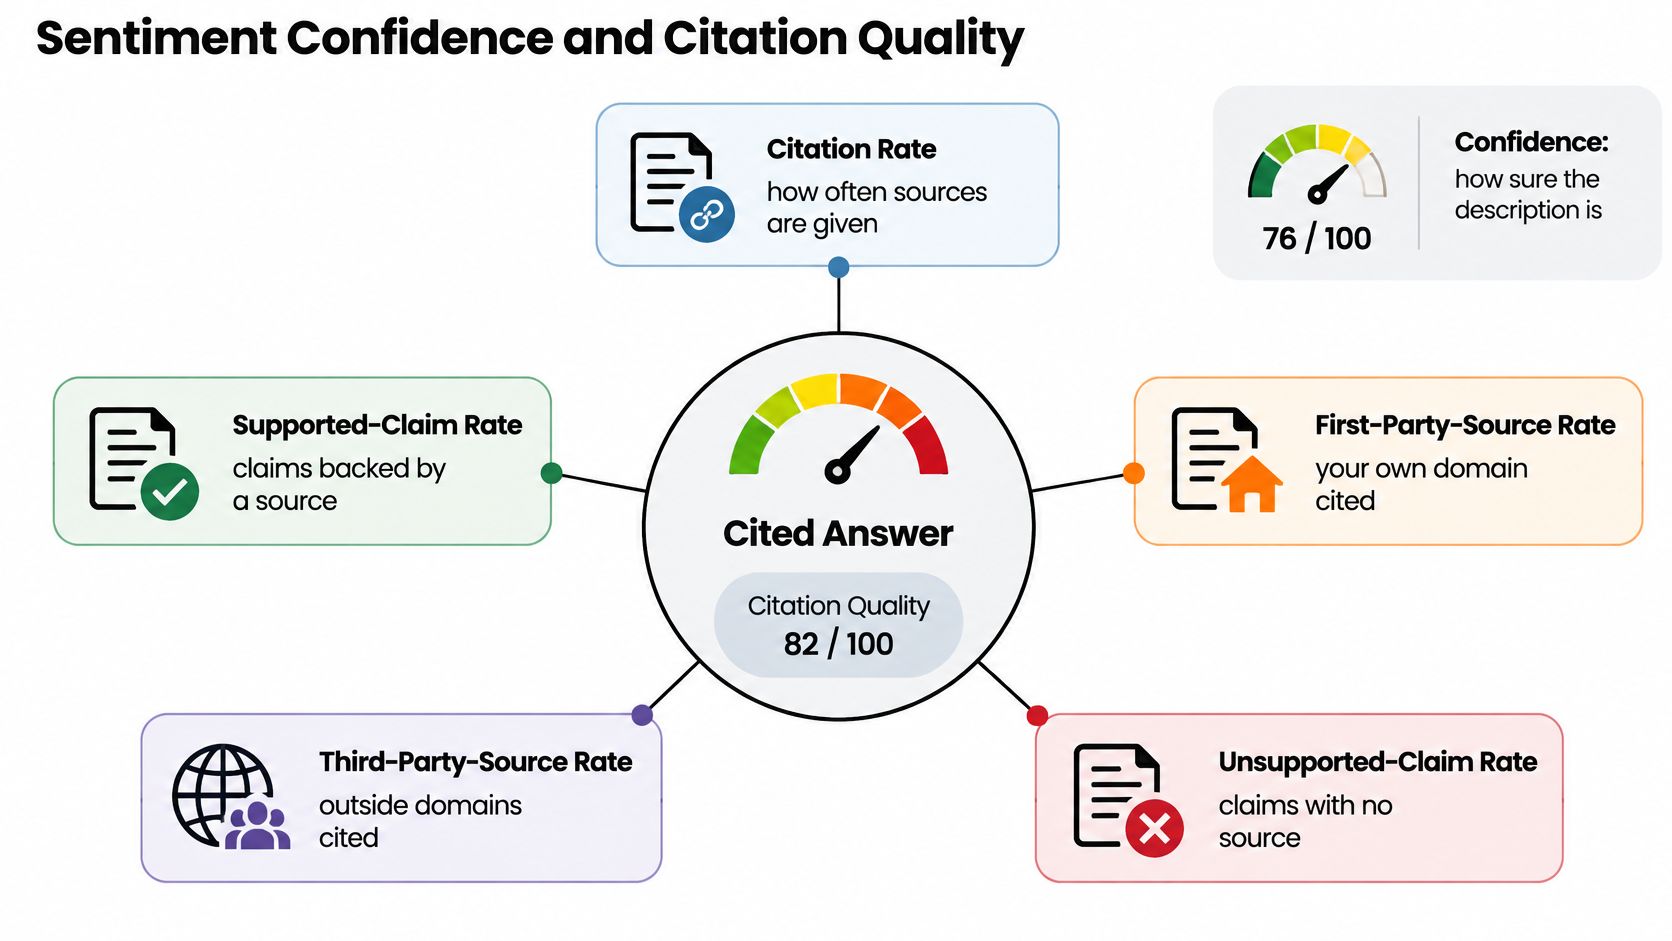
Being named and being accurately supported are separate achievements. A 2025 Tow Center study, reported by Nieman Lab, tested 1,600 citation-retrieval queries across eight AI search products and found incorrect publication details or URLs in more than 60% of cases. That finding concerns the tested retrieval task, not an error rate to apply automatically to your brand's answers.
Audit claims rather than counting links
Suppose an assistant recommends a product for single sign-on but cites an old blog post that never mentions that capability. The URL may load successfully and belong to the correct company. It still doesn't support the recommendation.
Assess each cited claim for URL correctness, accessibility, freshness, topical fit, and entailment. Entailment means the cited page supports what the assistant said. Freshness should reflect whether the information remains current for the claim, not whether the page has a recent date.
Report a claim-level audit with explicit denominators:
| Audit rate | Numerator | Denominator |
|---|---|---|
| Citation rate | Audited claims with an attached citation | All audited factual claims |
| Supported-claim rate | Claims supported by attached evidence | All audited factual claims |
| First-party-source rate | Claims citing the brand's own sources | All audited factual claims |
| Third-party-source rate | Claims citing outside sources | All audited factual claims |
| Unsupported-claim rate | Claims without adequate attached support | All audited factual claims |
First-party and third-party rates can overlap when a claim cites both. An unsupported claim isn't necessarily false; it means the attached evidence doesn't substantiate it under the audit rules.
Separate annotation uncertainty from sampling uncertainty
Use trained reviewers on a calibration sample, compare their judgments, and resolve disagreements with written rules. Preserve adjudicated examples so that later reviewers apply the same standard. The ISO/IEC 25022 quality-in-use standard provides a useful grounding for evaluating effectiveness and risk in a specified usage context rather than treating technical presence as sufficient quality.
Track source classes separately: documentation, pricing, reviews, partners, marketplaces, and community discussions. A stale pricing page calls for a different fix from an inaccurate third-party review.
For sentiment, distinguish an accurate limitation from a fabricated criticism. A correct caveat may lower a polarity score while improving the buyer's understanding. Record the factual judgment alongside the sentiment label.
Confidence intervals address sampling uncertainty. Reviewer disagreement addresses classification uncertainty. Neither should be replaced by a reassuring badge, and the confidence concept in the visual shouldn't be interpreted as the assistant's self-reported certainty.
Use a citation-analysis review process before trusting a rising citation-share trend. Audit a manageable batch of cited claims, starting with pricing, security, and product capabilities. Prioritize unsupported statements that could materially change a purchase decision, even when their surrounding sentiment is positive.
Why Scores Differ Across AI Platforms
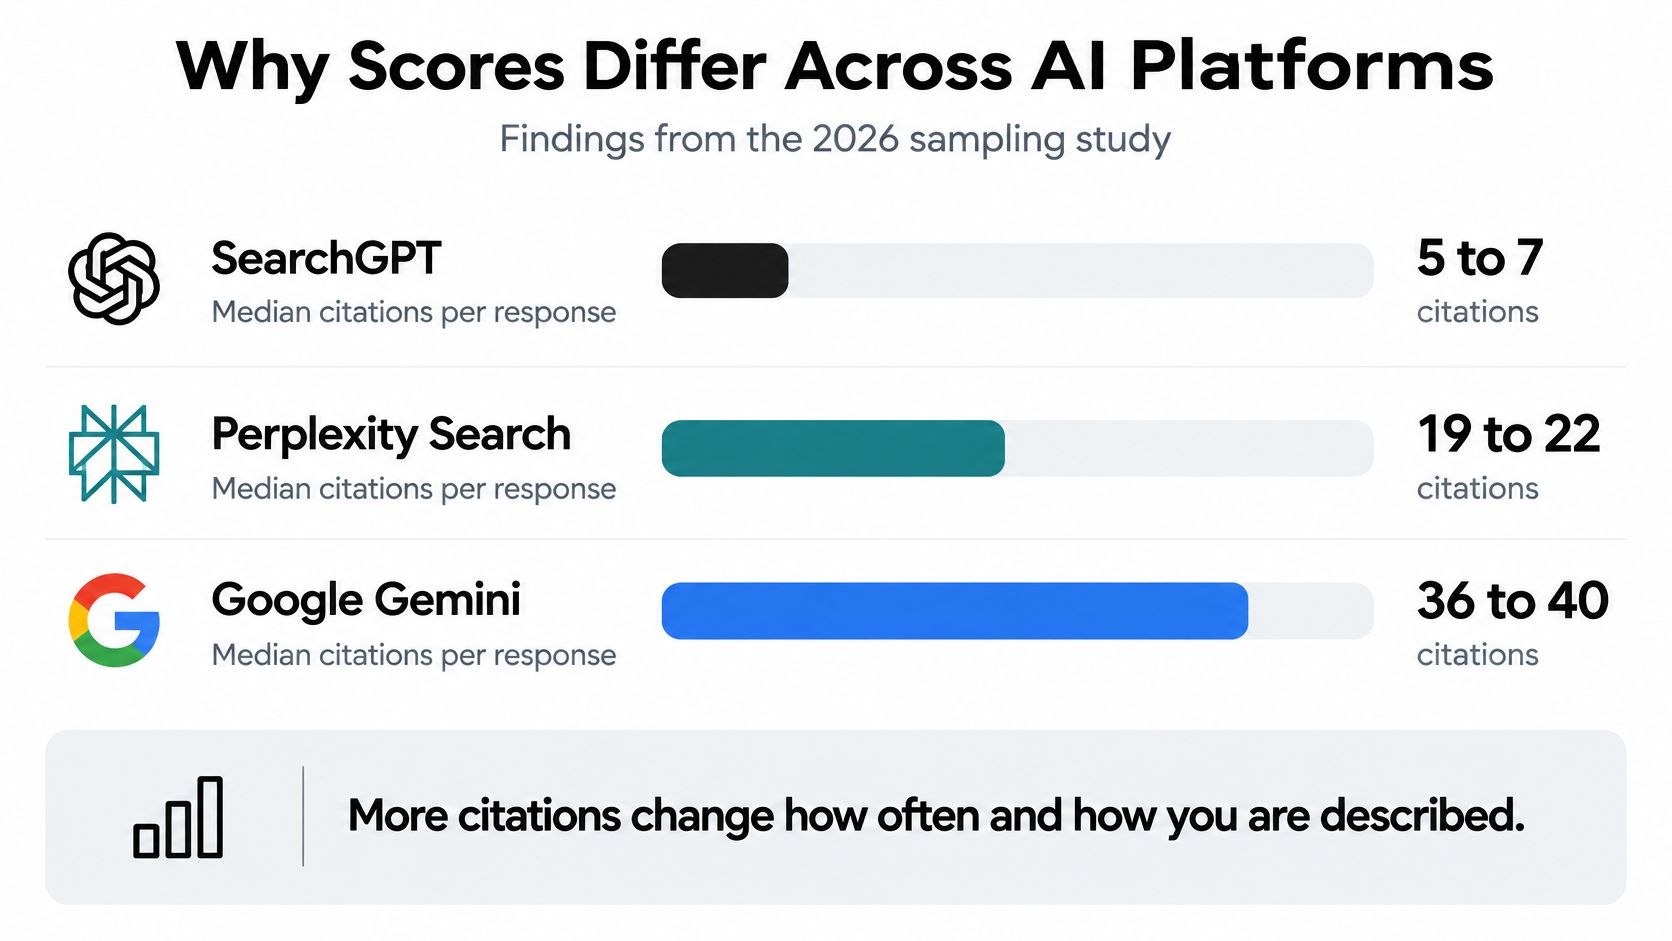
A 2026 three-platform sampling study reported median citations per response of 5–7 for SearchGPT, 19–22 for Perplexity Search, and 36–40 for Google Gemini, using daily collection over nine days and high-frequency collection every ten minutes. Those ranges make raw citation totals a poor cross-provider leaderboard.
An assistant that produces more citation opportunities can yield more brand-domain links without giving the brand a greater relative presence. Normalize the measurement within each provider before comparing patterns.
Different systems expose different source sets
A 2026 source-overlap study analyzed 14,212 queries and reported Jaccard similarities of 0.11–0.18 among retrieved sources from Google Search, Google AI Overviews, and Gemini. Treating those systems as a single source ecosystem would hide substantial differences in which websites appeared.
User behavior also complicates comparisons. In a 2025 study of 1,526 U.S. participants, ChatGPT users completed practical search tasks faster and reached correct answers more often than Google users, but relied significantly less on primary web sources. That pattern makes low referral volume insufficient evidence of low exposure value.
Published benchmarks for reading AI visibility
| Source | What was measured | Result | How to use it |
|---|---|---|---|
| Three-platform sampling study | Citations per generated answer | Substantial differences in citation volume | Don't rank raw totals across providers |
| Source-overlap comparison | Retrieved-source similarity | Limited overlap across tested systems | Treat each system as its own source set |
| Princeton GEO experiment | Visibility after evidence-rich content changes | Gains under experimental conditions | Treat improvements as conditional, not promised |
| Adobe survey | Reported search replacement and recommendation use | Assistants used for discovery and buying tasks | Include buyer-intent prompts |
| Tow Center citation test | Citation-retrieval accuracy | Frequent incorrect details or URLs in the tested task | Audit validity separately from citation presence |
These benchmarks answer different questions. None supplies a universal target for an individual brand.
Compare against the appropriate baseline
For platform comparisons, store provider, prompt, date, location, search mode, and sampling frequency. Report distributions or means across repeated runs, and assess rank changes against the observed variability. Don't publish a blended rank without revealing its provider composition.
A provider comparison should distinguish collection coverage from consumer usage. Our provider checks use provider APIs; they don't reproduce every consumer app experience and don't track Google AI Overviews, Google AI Mode, or Microsoft Copilot. Those exclusions belong beside the chart, not in a hidden methodology note.
For outcomes, compare referral sessions with assisted conversions and brand-recall evidence collected through your own measurement process. Don't infer an unobserved conversion from a mention, but don't declare exposure worthless solely because no session followed.
Judge each provider against its own baseline before comparing the direction of change across providers.
How Metrics Point to the Next Action
| Signal pair | What it rules out | Next action |
|---|---|---|
| Visibility up and rank flat | Inclusion improved, but placement didn't | Add relevant evidence on pages already cited |
| Visibility flat and share of voice down | You didn't disappear; competitors gained representation | Address their differentiators on relevant cited URLs |
| Rank better and sentiment worse | A higher slot isn't necessarily a stronger endorsement | Verify the caveat and correct inaccurate source claims |
| Citation share up and quality down | Link presence doesn't establish support | Publish or update a page that substantiates the claim |
| Mentions up and visits flat | More exposure didn't become more measured sessions | Inspect attribution coverage and assisted conversions |
| One prompt drops and the average holds | The aggregate doesn't represent every buying question | Investigate that intent before a sitewide rewrite |
Use paired signals to test explanations
The table supplies diagnostic hypotheses, not automatic causal conclusions. Visibility can rise while rank stays flat because the brand entered additional recommendation lists, but you still need to inspect those answers. Share of voice can fall because competitors gained mentions or because your tracking taxonomy changed.
Likewise, a worse sentiment score doesn't automatically justify editing a page. If an assistant accurately describes a real product limitation, the decision may belong with product marketing or the product team rather than SEO.
For content changes, the Princeton GEO study summary reports that adding quotations, statistics, and citations each produced roughly 25–40% more visibility across 10,000 queries in the 2024 experiment. Treat that range as an experimental result, not a forecast for your next release.
The broader GEO benchmark account distinguishes evidence-rich changes from conventional keyword stuffing, which didn't deliver comparable benefits and could reduce performance. The practical implication is to substantiate useful claims, not to repeat target phrases more aggressively.
Prioritize investigation before publication
Use a weekly review sequence:
- Check uncertainty. Determine whether the measured difference is distinguishable from ordinary variation under the collection design.
- Inspect prompt-level gaps. Identify commercially important intents where the brand lost inclusion or placement.
- Validate cited claims. Separate missing evidence, stale evidence, and inaccurate generated descriptions.
- Review outcomes. Inspect detectable referrals and completed conversions without treating them as interchangeable.
Translate the findings into a backlog with explicit gap rules. Each task should name the affected prompt, provider, source page, observed failure, and evidence needed to consider the issue resolved.
An AI traffic visit is separate from a mention, signup, or purchase. Completed conversions belong in your analytics or billing system, while missing referrers, blocked scripts, and source classification can limit traffic coverage.
The most useful AI visibility metrics don't merely tell the team that a score changed. They identify which explanation remains plausible, which evidence is missing, and which bounded piece of work deserves the next test.
MyMentions tracks how AI assistants mention, rank, and describe your product across buyer prompts, with competitors, citations, and AI-driven traffic in one workspace. Visit MyMentions to organize your prompt panel and turn inspectable visibility gaps into a prioritized measurement and improvement backlog.